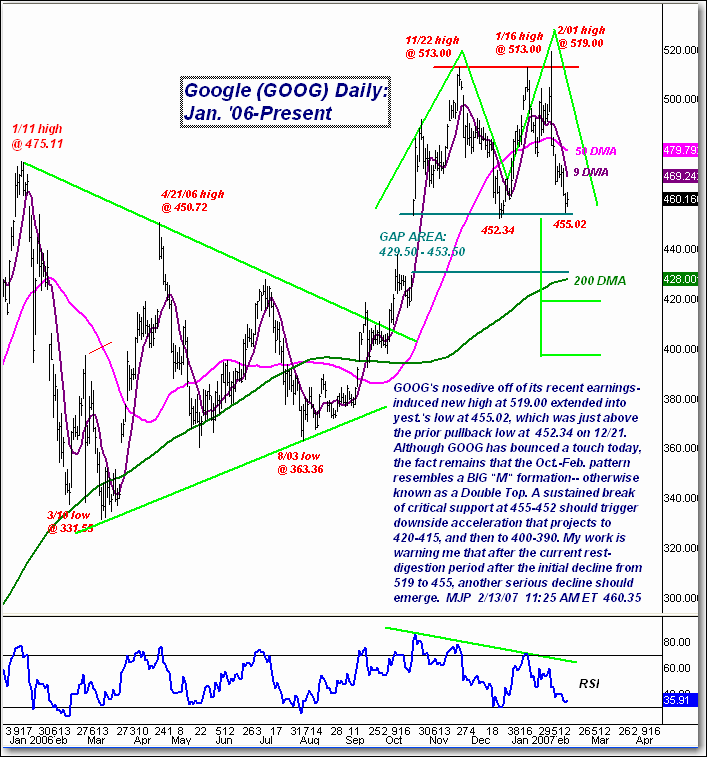
Google Pattern Resembles Double Top
Google's (Nasdaq: GOOG) nosedive off its recent earnings-induced new high at 519.00 extended into yesterday's low at 455.02, which was just above the prior pullback low at 452.34 on 12/21. Although GOOG has bounced a touch today, the fact remains that the Oct-Feb pattern resembles a big "M" formation -- otherwise known as a Double Top. A sustained break of critical support at 455-452 should trigger downside acceleration that projects to 420-415, and then to 400-390. My work is warning me that after the current rest-digestion period after the initial decline from 519 to 455, another serious decline should emerge.