Has 10-Year YIELD Started a New Upleg?
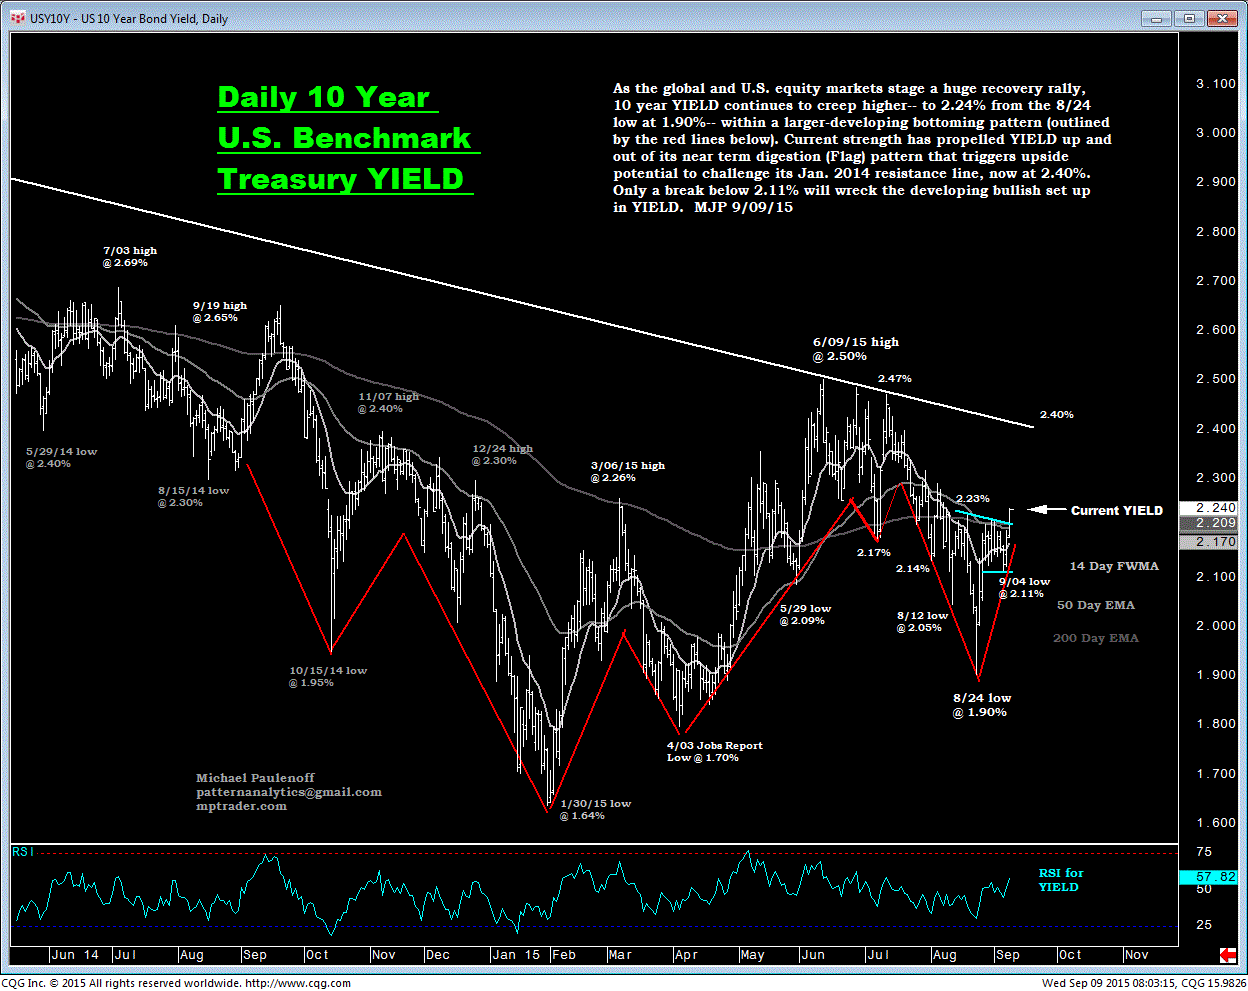
As the global and U.S. equity markets stage a huge recovery rally, 10-year YIELD continues to creep higher-- to 2.24% from the Aug 24 low at 1.90%-- within a larger-developing bottoming pattern (outlined by the red lines below).
Current strength has propelled YIELD up and out of its near-term digestion (flag) pattern that triggers upside potential to challenge its Jan, 2014, resistance line, now at 2.40%.
Only a break below 2.11% will wreck the developing bullish set-up in YIELD.

