Has GDX Ended a Near Term Correction?
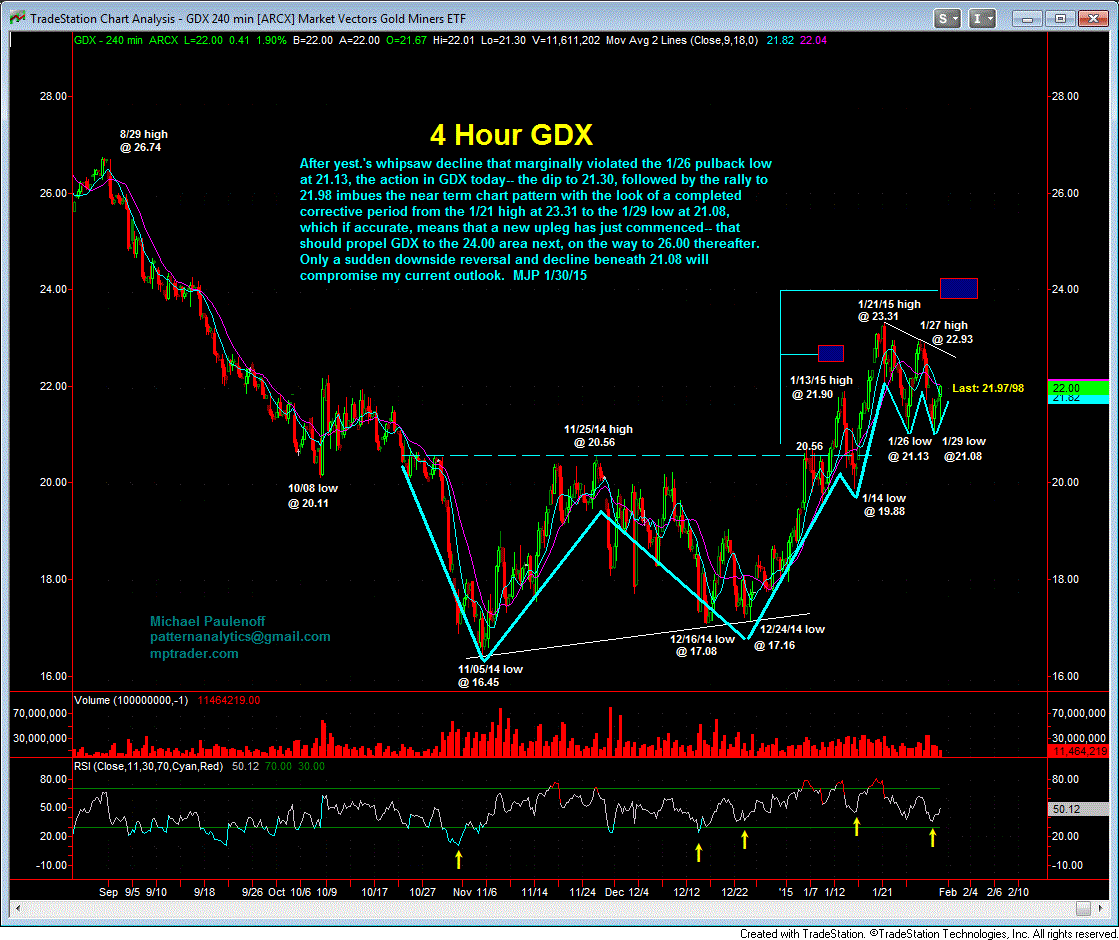
After yesterday’s whipsaw decline that marginally violated the Jan 26 pullback low at 21.13, the action the Market Vectors Gold Miners ETF (GDX) today--the dip to 21.30, followed by the rally to 21.98 imbues the near-term chart pattern with the look of a completed corrective period from the Jan 21 high at 23.31 to the Jan 29 low at 21.08, which if accurate, means that a new upleg has just commenced--that should propel GDX to the 24.00 area next, on the way to 26.00 thereafter.
Only a sudden downside reversal and decline beneath 21.08 will compromise my current outlook.

