Homebuilders Stocks on the Move
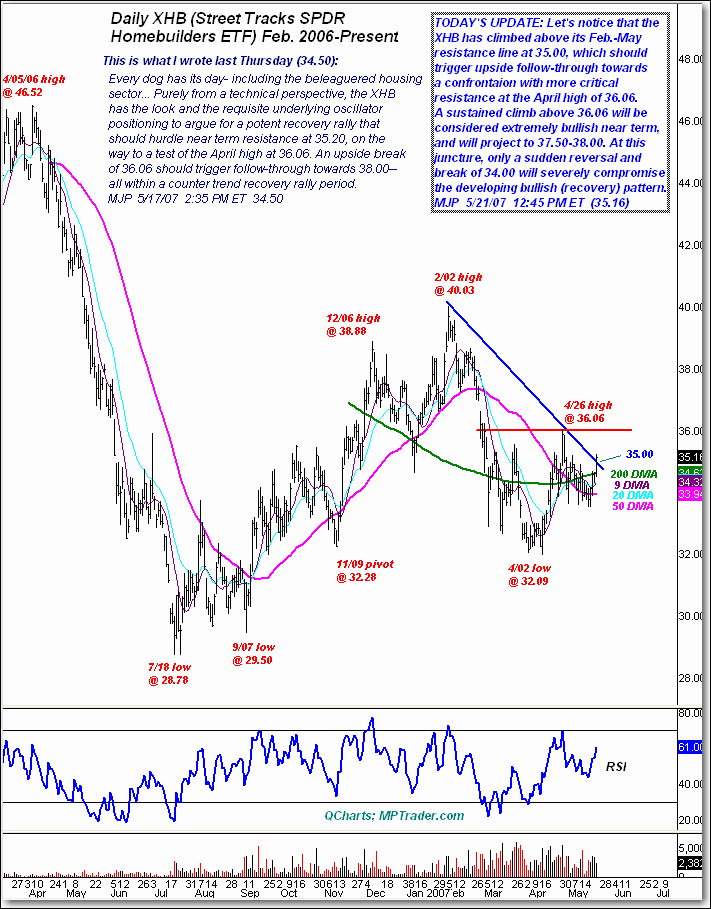
Last Thursday with the streetTRACKS SPDR Homebuilders ETF (XHB) trading at 34.50, we wrote that the chart argued for a potent recovery that should hurdle near-term resistance at 35.20 on the way to test the April high at 36.06. Today the XHB has climbed above its Feb-May resistance line at 35, which should trigger upside follow-through towards that critical 36.06 area. A sustained climb above that would be considered extremely bullish near-term and project to 37.50-38. At this juncture, only a sudden reversal and break of 34 will severely compromise the developing bullish (recovery) pattern.

