Is GOOG's EKG Chart Nearing Some Sign of Life?
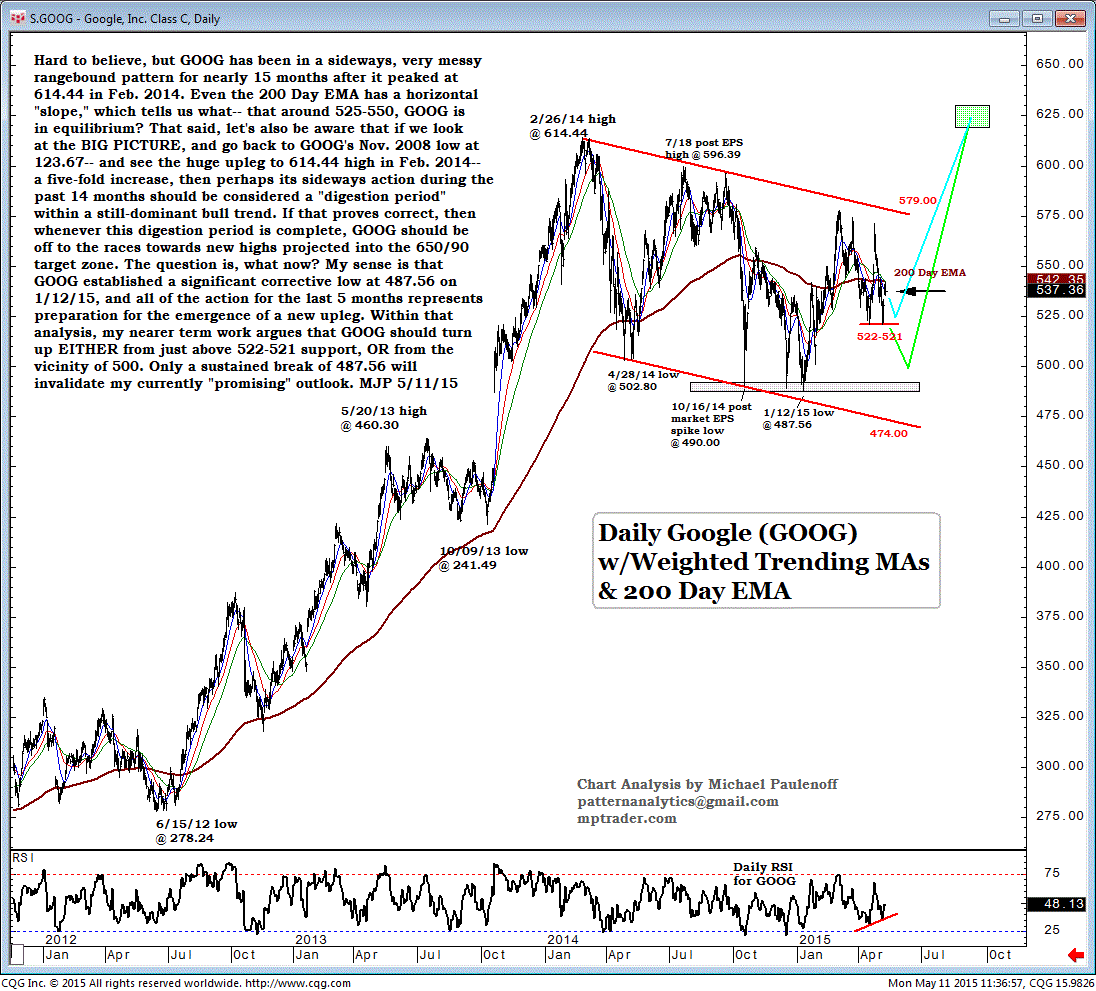
Hard to believe, but Google Inc. (GOOG) has been in a sideways, very messy, range-bound pattern for nearly 15 months after it peaked at 614.44 in Feb 2014.
Even the 200-Day EMA has a horizontal "slope," which tells us what-- that around 525-550, GOOG is in equilibrium?
That said, let's also be aware that if we look at the big picture, and go back to GOOG's Nov 2008 low at 123.67-- and see the huge upleg to 614.44 high in Feb 2014-- a five-fold increase, then perhaps its sideways action during the past 14 months should be considered a "digestion period" within a still-dominant bull trend.
If that proves correct, then whenever this digestion period is complete, GOOG should be off to the races towards new highs projected into the 650/90 target zone.
The question is, what now?
My sense is that GOOG established a significant corrective low at 487.56 on Jan 12, 2015, and all of the action for the last 5 months represents preparation for the emergence of a new upleg.
Within that analysis, my nearer-term work argues that GOOG should turn up either from just above 522-521 support, or from the vicinity of 500.
Only a sustained break of 487.56 will invalidate my currently "promising" outlook.

