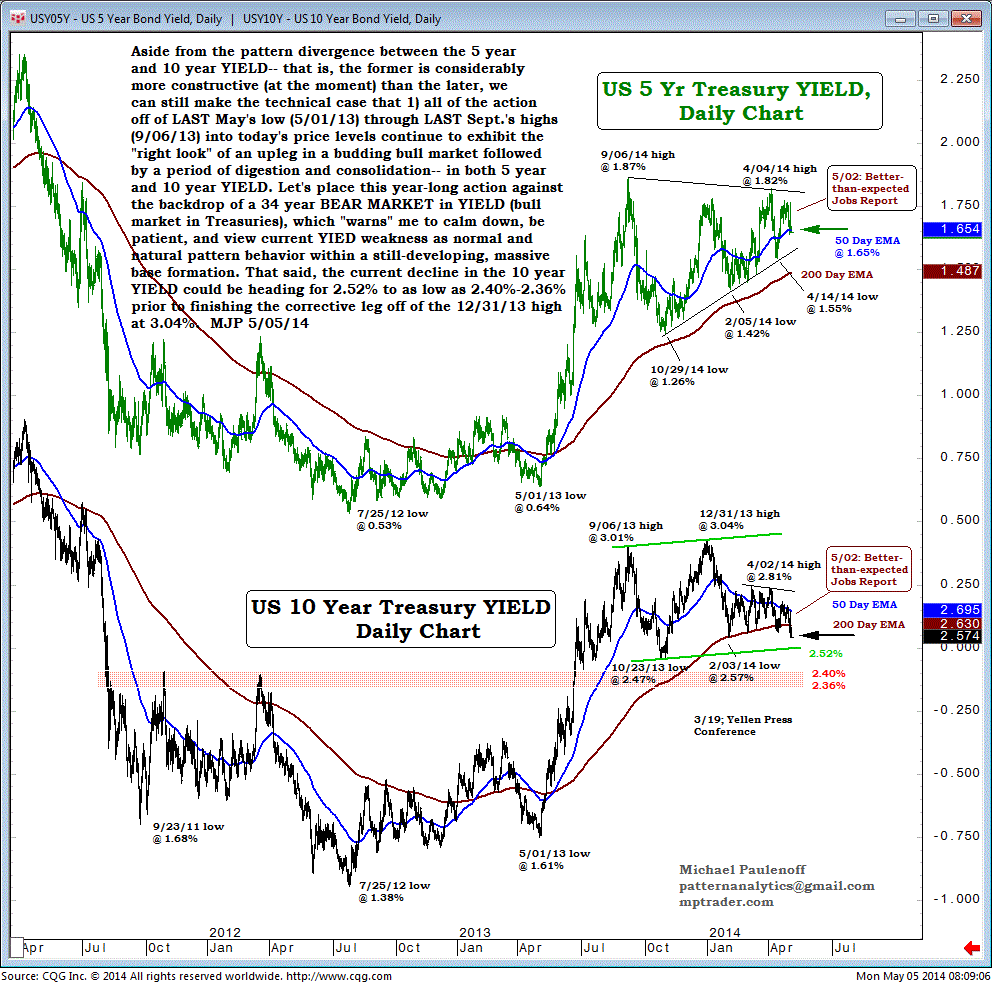
Longer-Term Yield Plunges, But Huge Base Patterns Continue to Develop
Aside from the pattern divergence between the 5-year and 10-year Yield that is, the former is considerably more constructive at the moment than the later, we can still make the technical case that all of the action off of the May 2013 low through Sept 2013 highs into today's price levels continue to exhibit the "right look" of an upleg in a budding bull market followed by a period of digestion and consolidation in both 5-year and 10-year Yield.
Let's place this year-long action against the backdrop of a 34-year bear market in Yield (bull market in Treasuries), which "warns" me to calm down, be patient, and view current Yield weakness as normal and natural pattern behavior within a still-developing, massive base formation.
That said, the current decline in the 10-year Yield could be heading for 2.52% to as low as 2.40%-2.36% prior to finishing the corrective leg off of the Dec 31, 2013, high at 3.04%.