Lots of Noise in GOLD and GLD Chart Pattern
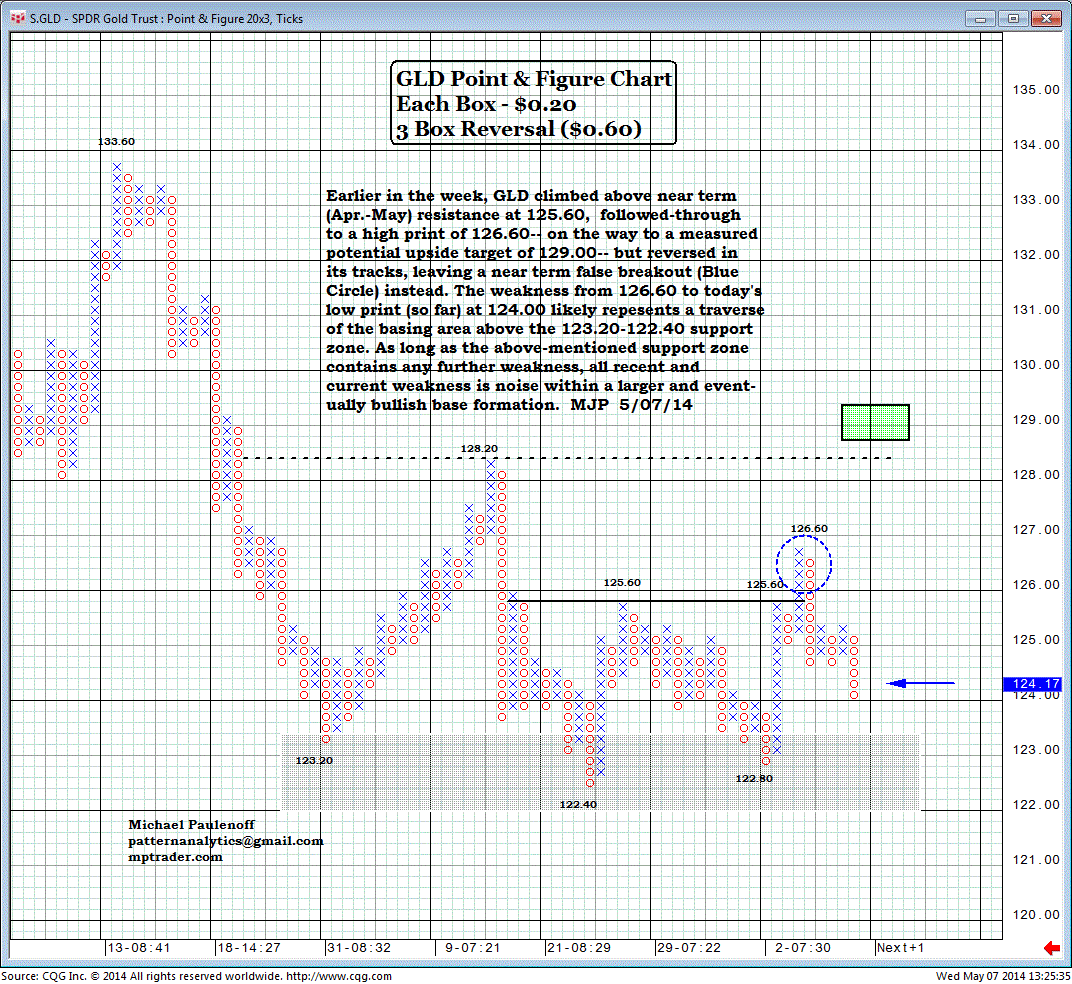
Earlier in the week, SPDR Gold Shares (GLD) climbed above near-term Apr-May resistance at 125.60.
It then followed-through to a high print of 126.60 on the way to a measured potential upside target of 129.00, but reversed in its tracks, leaving a near-term false breakout (blue circle on chart below) instead.
The weakness from 126.60 to today's low print (so far) at 124.00 likely represents a traverse of the basing area above the 123.20-122.40 support zone.
As long as the above-mentioned support zone contains any further weakness, all recent and current weakness is noise within a larger and eventually bullish-base formation.

