Market Analysis for Aug 15th, 2005
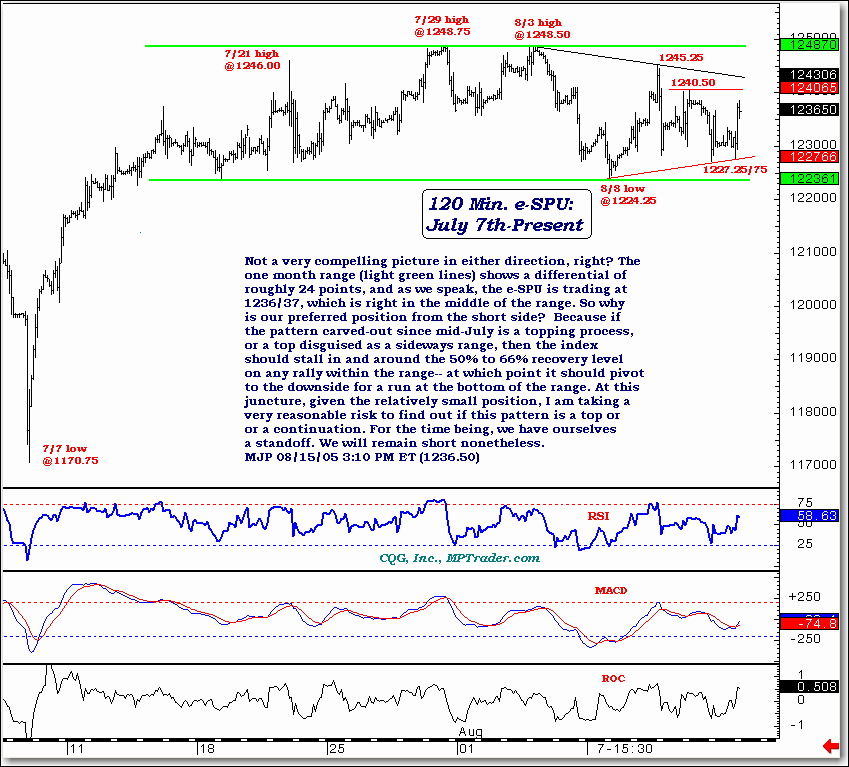
Not a very compelling picture in either direction, right? The
one month range (light green lines) shows a differential of
roughly 24 points, and as we speak, the e-SPU is trading at
1236/37, which is right in the middle of the range. So why
is our preferred position from the short side? Because if
the pattern carved-out since mid-July is a topping process,
or a top disguised as a sideways range, then the index
should stall in and around the 50% to 66% recovery level
on any rally within the range-- at which point it should pivot
to the downside for a run at the bottom of the range. At this
juncture, given the relatively small position, I am taking a
very reasonable risk to find out if this pattern is a top or
or a continuation. For the time being, we have ourselves
a standoff. We will remain short nonetheless.
MJP 08/15/05 3:10 PM ET (1236.50)
For more of Mike Paulenoff, sign up for a FREE 30-Day Trial to his E-Mini/Index Futures diary. Or try his QQQ Trading Diary.

