Market Analysis for Aug 25th, 2004
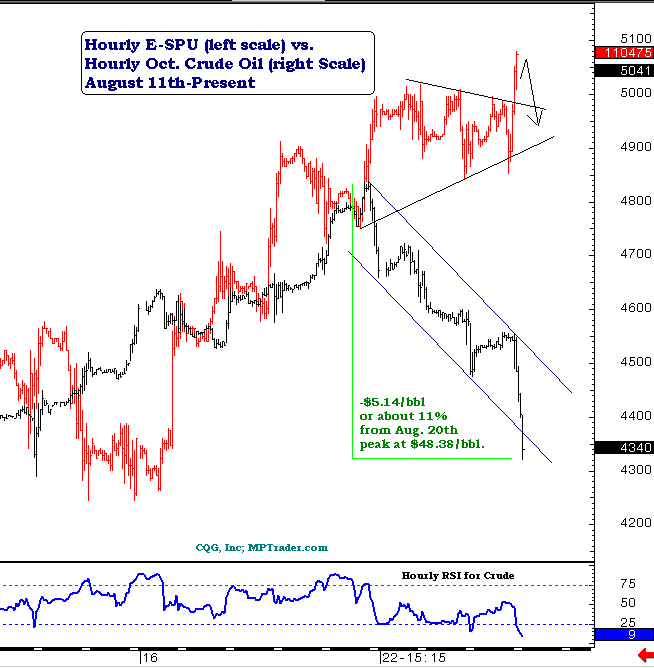
For today's Mid-Day Minute, Mike writes: Will the rally in the equity indices continue merely based on the decline in crude oil prices? My work argues that today's rally represents the final upmove of the up-leg that began on August 13th at 1060 in the SPU, which measures into the 1104-1107 target zone prior to an expected downside pivot reversal. Have a look at our updated hourly overlay chart that shows the concurrent moves in the E-mini Sept S&P and oil for the last few days...
For more of Mike Paulenoff, sign up for a FREE 30-Day Trial to his E-Mini/Index Futures diary at. Or try his QQQ Trading Diary.

