
Market Analysis for Feb 10th, 2003
Big Picture Weekly Cash S&P
By Michael Paulenoff, MPTrader.com
By Michael Paulenoff, MPTrader.com
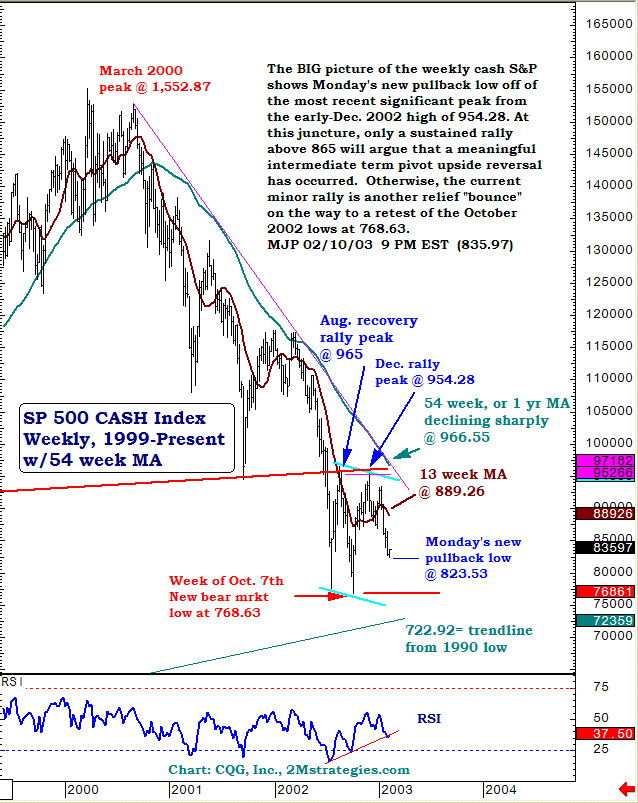
The BIG picture of the weekly cash S&P shows Monday's new pullback low off of the most recent significant peak from the early-Dec. 2002 high of 954.28. At this juncture, only a sustained rally above 865 will argue that a meaningful intermediate-term pivot upside reversal has occurred. Otherwise, the current minor rally is another relief "bounce" on the way to a retest of the October 2002 lows at 768.63.