Market Analysis for May 31st, 2005
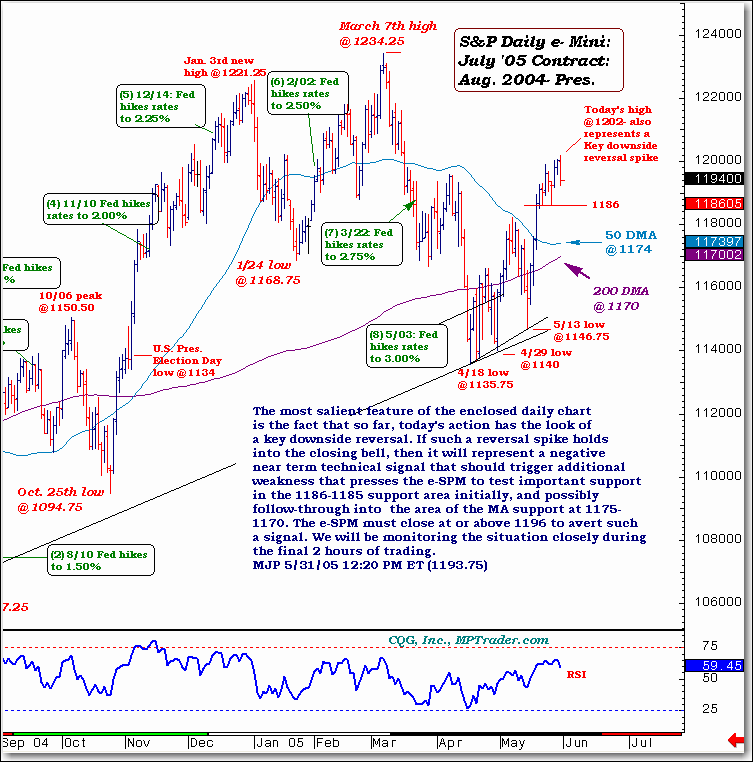
The most salient feature of the daily chart is the fact that so far today's action has the look of a key downside reversal. If such a reversal spike holds into the closing bell, then it will represent a negative near-term technical signal that should trigger additional weakness that presses the E-mini June S&P to test important support in the 1186-1185 support area initially, and possibly follow-through into the area of the MA support at 1175-1170. The E-mini June S&P must close at or above 1196 to avert such a signal. We will be monitoring the situation closely during the final two hours of trading.
For more of Mike Paulenoff, sign up for a FREE 30-Day Trial to his E-Mini/Index Futures diary. Or try his QQQ Trading Diary.

