Market Analysis for Nov 16th, 2004
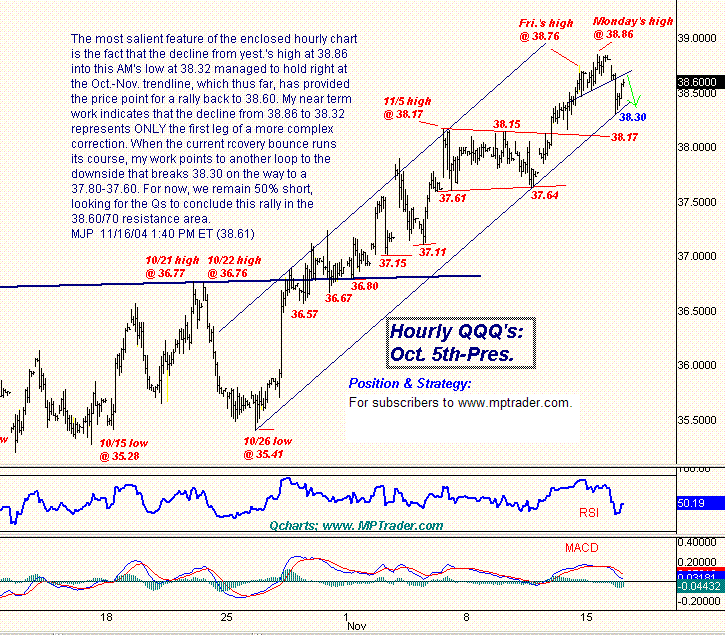
The most salient feature of the QQQ hourly chart
is the fact that the decline from yesterday's high at 38.86
into this AM's low at 38.32 managed to hold right at
the Oct.-Nov. trendline, which thus far, has provided
the price point for a rally back to 38.60. My near term
work indicates that the decline from 38.86 to 38.32
represents ONLY the first leg of a more complex
correction. When the current recovery bounce runs
its course, my work points to another loop to the
downside that breaks 38.30 on the way to a
37.80-37.60. For now, we remain 50% short,
looking for the Qs to conclude this rally in the
38.60/70 resistance area.
For more of Mike Paulenoff, sign up for a FREE 30-Day Trial to his E-Mini/Index Futures diary at. Or try his QQQ Trading Diary.

