Market Analysis for Nov 17th, 2004
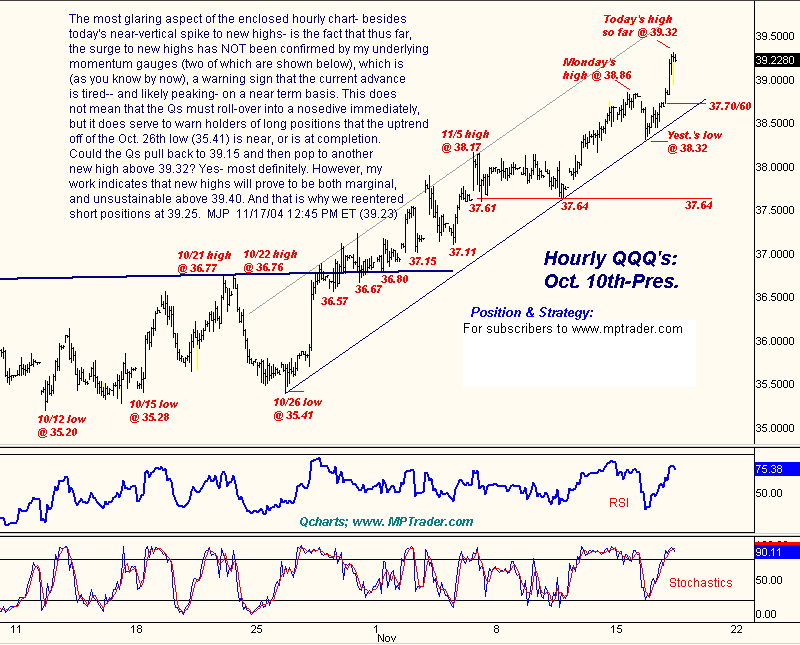
The most glaring aspect of the QQQ hourly chart -- besides
today's near-vertical spike to new highs -- is the fact that thus far,
the surge to new highs has NOT been confirmed by my underlying
momentum gauges (two of which are shown below), which is
(as you know by now), a warning sign that the current advance
is tired-- and likely peaking- on a near term basis. This does
not mean that the Qs must roll-over into a nosedive immediately,
but it does serve to warn holders of long positions that the uptrend
off of the Oct. 26th low (35.41) is near, or is at completion.
Could the Qs pull back to 39.15 and then pop to another
new high above 39.32? Yes, most definitely. However, my
work indicates that new highs will prove to be both marginal,
and unsustainable above 39.40. And that is why we re-entered
short positions at 39.25.
For more of Mike Paulenoff, sign up for a FREE 30-Day Trial to his E-Mini/Index Futures diary at. Or try his QQQ Trading Diary.

