Market Analysis for Nov 24th, 2004
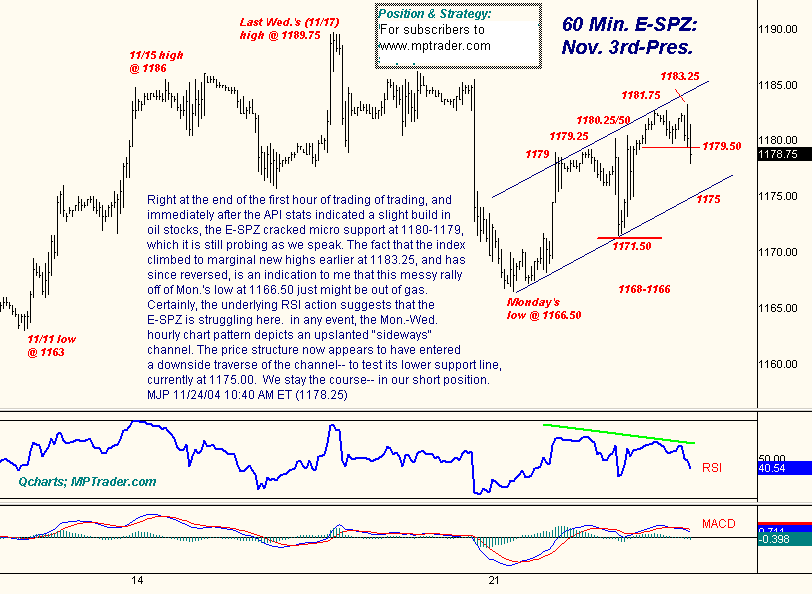
In our last Mid-Day Minute of this holiday-shortened week, Mike writes: Right at the end of the first hour of trading of trading, and
immediately after the API stats indicated a slight build in
oil stocks, the E-SPZ cracked micro support at 1180-1179,
which it is still probing as we speak. The fact that the index
climbed to marginal new highs earlier at 1183.25, and has
since reversed, is an indication to me that this messy rally
off of Mon.'s low at 1166.50 just might be out of gas.
Certainly, the underlying RSI action suggests that the
E-SPZ is struggling here. in any event, the Mon.-Wed.
hourly chart pattern depicts an upslanted "sideways"
channel. The price structure now appears to have entered
a downside traverse of the channel-- to test its lower support line,
currently at 1175.00. We stay the course-- in our short position.
For more of Mike Paulenoff, sign up for a FREE 30-Day Trial to his E-Mini/Index Futures diary at. Or try his QQQ Trading Diary.

