Market Analysis for Oct 19th, 2005

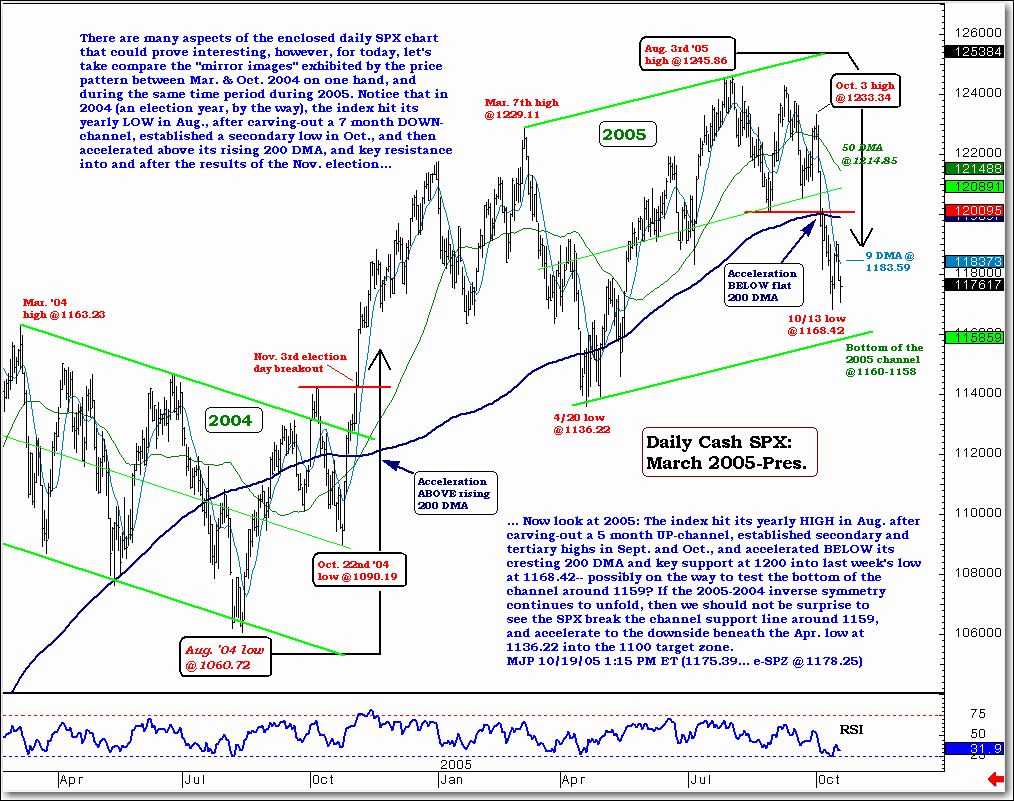
There are many aspects of the enclosed daily SPX chart that could prove interesting, however, for today, let's take compare the "mirror images" exhibited by the price pattern between Mar. & Oct. 2004 on one hand, and during the same time period during 2005. Notice that in 2004 (an election year, by the way), the index hit its yearly LOW in Aug., after carving-out a 7 month DOWN- channel, established a secondary low in Oct., and then accelerated above its rising 200 DMA, and key resistance into and after the results of the Nov. election...

Now look at 2005: The index hit its yearly HIGH in Aug. after carving-out a 5 month UP-channel, established secondary and tertiary highs in Sept. and Oct., and accelerated BELOW its cresting 200 DMA and key support at 1200 into last week's low at 1168.42-- possibly on the way to test the bottom of the channel around 1159? If the 2005-2004 inverse symmetry continues to unfold, then we should not be surprise to see the SPX break the channel support line around 1159, and accelerate to the downside beneath the Apr. low at 1136.22 into the 1100 target zone. MJP 10/19/05 1:15 PM ET (1175.39... e-SPZ @ 1178.25)

For more of Mike Paulenoff, sign up for a FREE 30-Day Trial to his E-Mini/Index Futures diary. Or try his QQQ Trading Diary.

  Matched
x
  • In our live, interactive Trading Room, we identify trading opportunities in ...
  • Equity Index Futures
  • Index & Sector ETFs
  • Individual Stocks
  • Precious Metals
  • Energy
  • Forex
  • Treasuries
  • International Markets
  • And Much More
Join MPTrader Now!
Veteran Wall Street analyst and financial author, Mike provides detailed and timely analysis and trade set-ups on a range of markets. Read more...

Have Mike's “Out Front” morning analysis delivered FREE to your email inbox twice weekly!