
Market Analysis for Sep 20th, 2004
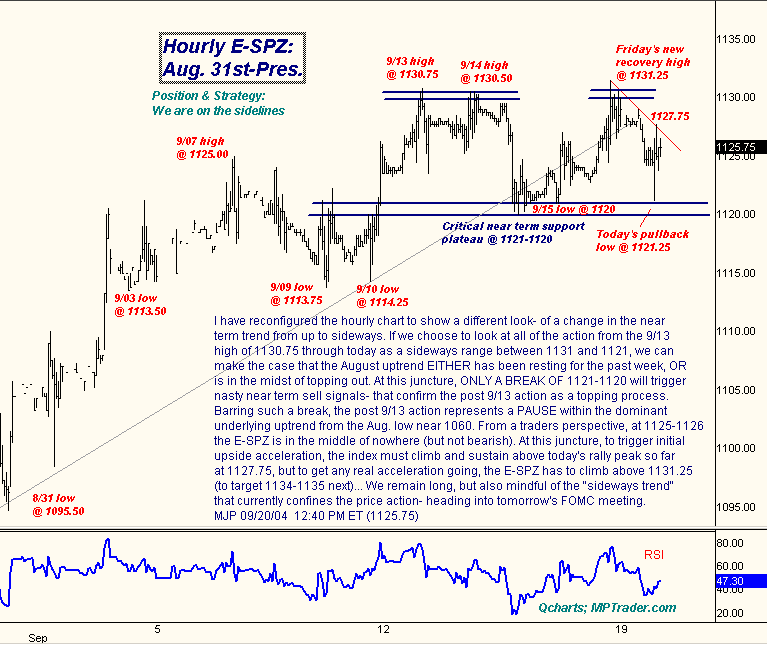
For today's Mid-Day Minute, Mike writes: I have reconfigured the hourly chart to show a different look -- of a change in the near-term trend from up to sideways. If we choose to look at all of the action from the 9/13 high of 1130.75 through today as a sideways range between 1131 and 1121, we can make the case that the August uptrend EITHER has been resting for the past week OR is in the midst of topping out. At this juncture, ONLY A BREAK of 1121-1120 will trigger nasty near-term sell signals that confirm the post 9/13 action as a topping process. Barring such a break, the post 9/13 action represents a PAUSE within the dominant underlying uptrend from the Aug. low near 1060. From a trader's perspective, at 1125-26, the E-mini S&P is in the middle of nowhere (but not bearish). At this juncture, to trigger initial upside acceleration, the index must climb and sustain above today's rally peak so far at 1127.75, but to get any real acceleration going, the E-mini S&P has to climb above 1131.25 (to target 1134-35). We remain long, but also mindful of the "sideways trend" that currently confines the price action -- heading into tomorrow's FOMC meeting.
For more of Mike Paulenoff, sign up for a FREE 30-Day Trial to his E-Mini/Index Futures diary at. Or try his QQQ Trading Diary.