Market Analysis for Sep 7th, 2005
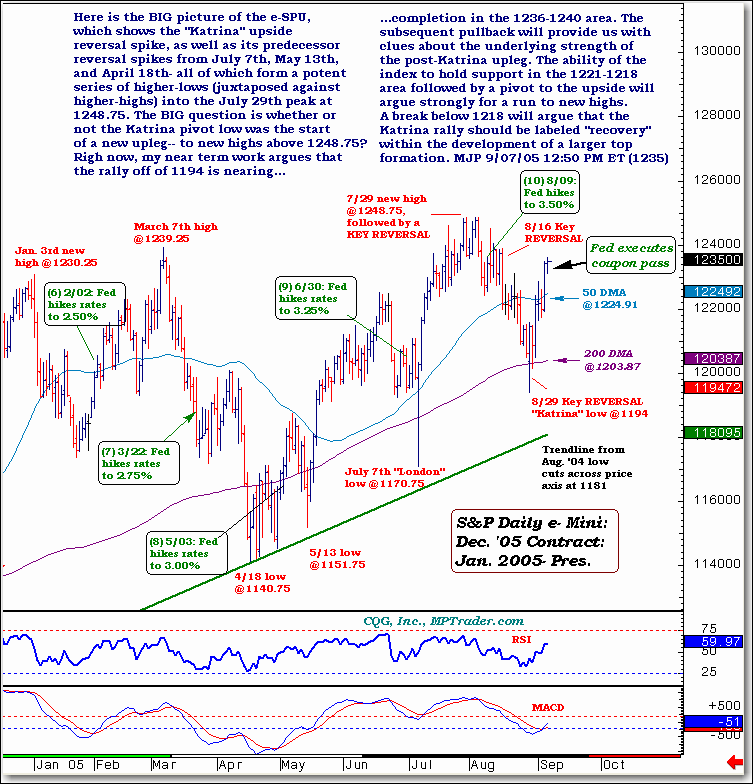
Here is the BIG picture of the e-SPU,
which shows the "Katrina" upside
reversal spike, as well as its predecessor
reversal spikes from July 7th, May 13th,
and April 18th- all of which form a potent
series of higher-lows (juxtaposed against
higher-highs) into the July 29th peak at
1248.75. The BIG question is whether or
not the Katrina pivot low was the start
of a new upleg-- to new highs above 1248.75?
Righ now, my near term work argues that
the rally off of 1194 is nearing completion in the 1236-1240 area. The
subsequent pullback will provide us with
clues about the underlying strength of
the post-Katrina upleg. The ability of the
index to hold support in the 1221-1218
area followed by a pivot to the upside will
argue strongly for a run to new highs.
A break below 1218 will argue that the
Katrina rally should be labeled "recovery"
within the development of a larger top
formation. MJP 9/07/05 12:50 PM ET (1235)
For more of Mike Paulenoff, sign up for a FREE 30-Day Trial to his E-Mini/Index Futures diary. Or try his QQQ Trading Diary.

