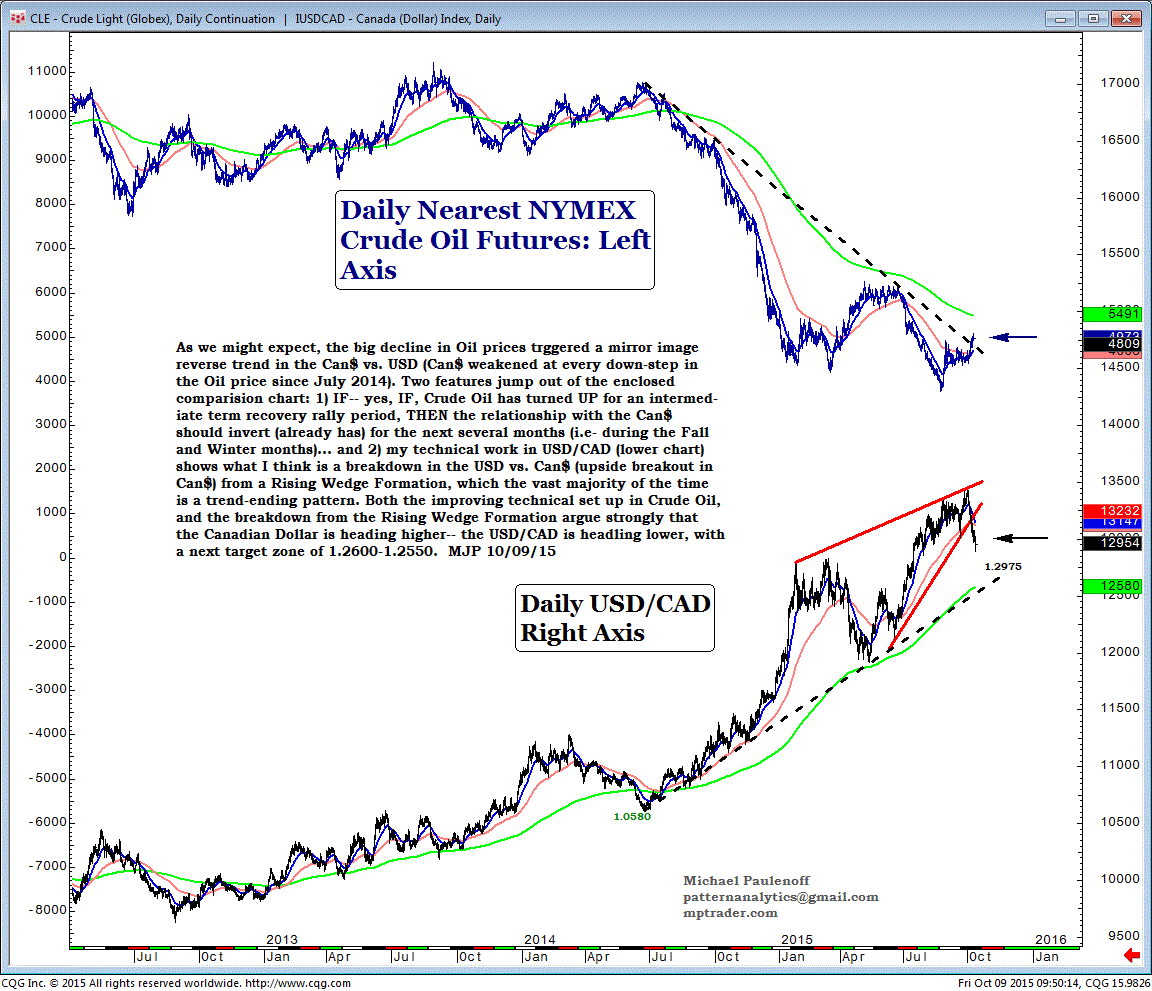
Mirror Images of Crude Oil and USD/CAD Argue Strongly for a Period of Commodity Price Recovery
As we might expect, the big decline in Oil prices triggered a mirror-image reverse trend in the CAD vs. USD (The Canadian Dollar (CAD) weakened at every down-step in the Oil price since July 2014).
Two features jump out of the enclosed comparison chart:
1) IF-- yes, IF, Crude Oil has turned up for an intermediate-term recovery-rally period, then the relationship with the CAD should invert (already has) for the next several months (i.e- during the Fall and Winter months), and
2) my technical work in USD/CAD (lower chart) shows what I think is a breakdown in the USD vs. CAD (upside breakout in CAD) from a rising-wedge formation, which the vast majority of the time is a trend-ending pattern.
Both the improving technical set-up in Crude Oil, and the breakdown from the rising-wedge formation argue strongly that the CAD is heading higher-- the USD/CAD is heading lower, with a next target zone of 1.2600-1.2550.

