My Big Picture INTC Set-Up Continues to Point Much Higher
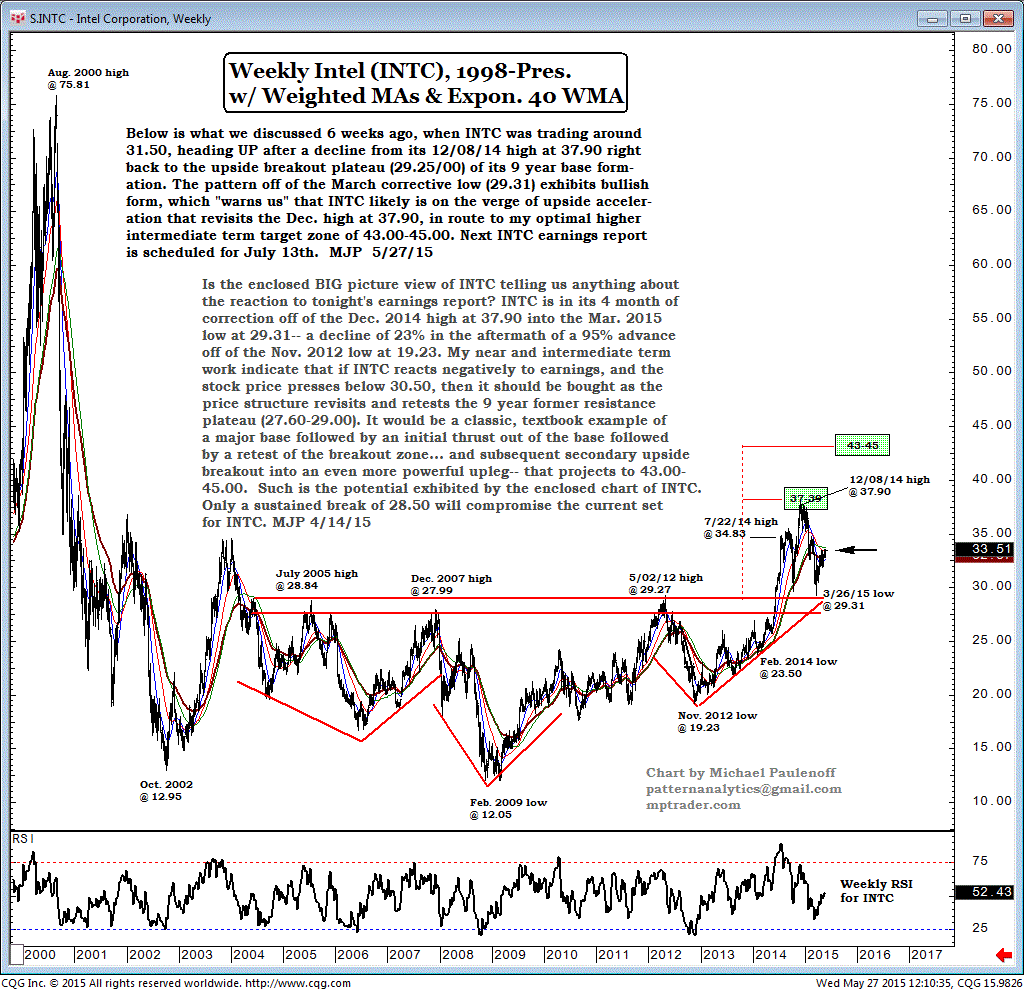
Below is what we discussed 6 weeks ago, when Intel Corporation (INTC) was trading around 31.50, heading up after a decline from its Dec 8 high at 37.90, right back to the upside-breakout plateau (29.25/00) of its 9-year base formation.
The pattern off of the March corrective low (29.31) exhibits bullish form, which "warns us" that INTC likely is on the verge of upside acceleration that revisits the Dec high at 37.90, in route to my optimal higher intermediate-term target zone of 43.00-45.00.
Next INTC earnings report is scheduled for July 13. MJP 5/27/15
Is the enclosed big-picture view of INTC telling us anything about the reaction to tonight's earnings report?
INTC is in its 4-month correction off of the Dec 2014 high at 37.90, into the Mar 2015 low at 29.31-- a decline of 23% in the aftermath of a 95% advance off of the Nov 2012 low at 19.23.
My near- and intermediate-term work indicate that if INTC reacts negatively to earnings, and the stock price presses below 30.50, then it should be bought as the price structure revisits and retests the 9-year, former-resistance plateau (27.60-29.00).
It would be a classic, textbook example of a major base followed by an initial thrust out of the base, followed by a retest of the breakout zone... and subsequent, secondary-upside breakout into an even more powerful upleg-- that projects to 43.00-45.00.
Such is the potential exhibited by the enclosed chart of INTC.
Only a sustained break of 28.50 will compromise the current set for INTC. MJP 4/14/15

