My Dollar Index Versus Gold Comparison Chart is at Crossroads
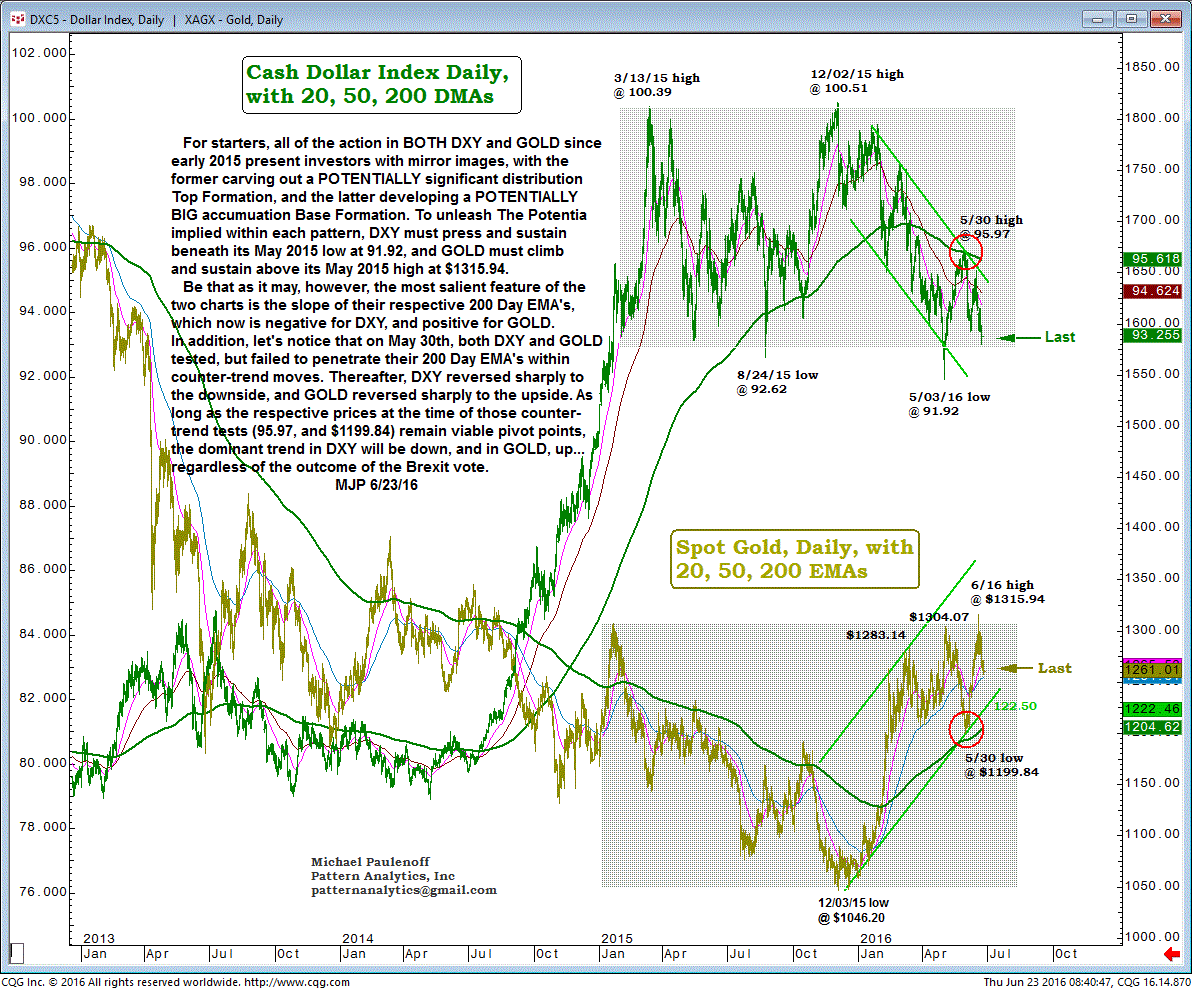
For starters, all of the action in both The Dollar Index (DXY) and GOLD since early 2015 present investors with mirror images, with the former carving out a potentially significant, distribution Top Formation, and the latter developing a potentially big, accumulation Base Formation.
To unleash The Potential implied within each pattern, DXY must press and sustain beneath its May 2015 low at 91.92, and GOLD must climb and sustain above its May 2015 high at $1315.94.
Be that as it may, however, the most salient feature of the two charts is the slope of their respective 200-Day EMA's, which now is negative for DXY, and positive for GOLD.
In addition, let's notice that on May 30, both DXY and GOLD tested, but failed to penetrate their 200 Day EMA's within counter-trend moves.
Thereafter, DXY reversed sharply to the downside, and GOLD reversed sharply to the upside. As long as the respective prices at the time of those counter- trend tests (95.97, and $1199.84) remain viable pivot points, the dominant trend in DXY will be down, and in GOLD, up... regardless of the outcome of the Brexit vote.

