My SPY P&F Chart Work Defines The Challenges for The Bulls
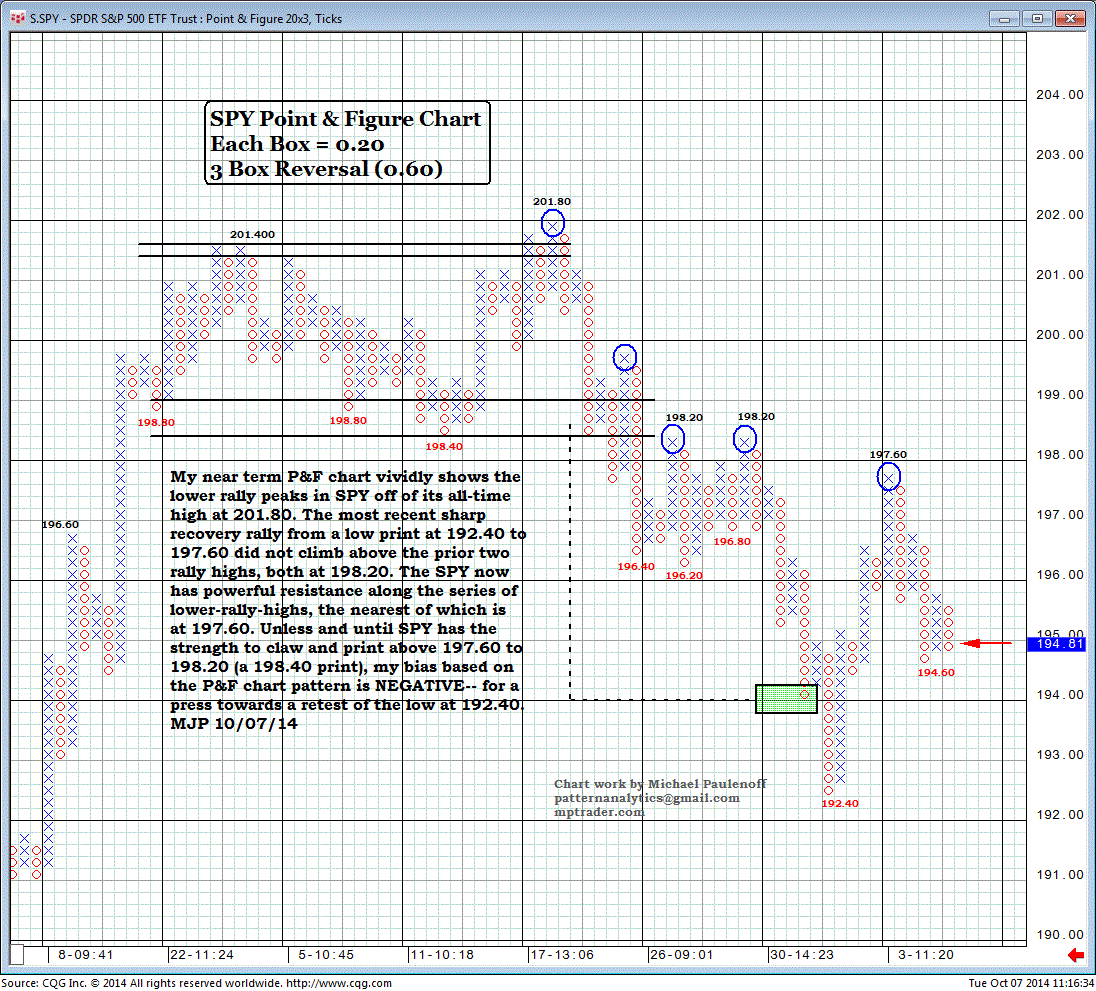
My near-term P&F chart vividly shows the lower-rally peaks in SPY off of its all-time high at 201.80.
The most recent sharp, recovery rally from a low print at 192.40 to 197.60 did not climb above the prior two rally highs, both at 198.20.
The SPY now has powerful resistance along the series of lower-rally-highs, the nearest of which is at 197.60.
Unless and until SPY has the strength to claw and print above 197.60 to 198.20 (a 198.40 print), my bias based on the P&F-chart pattern is negative for a press towards a retest of the low at 192.40.

