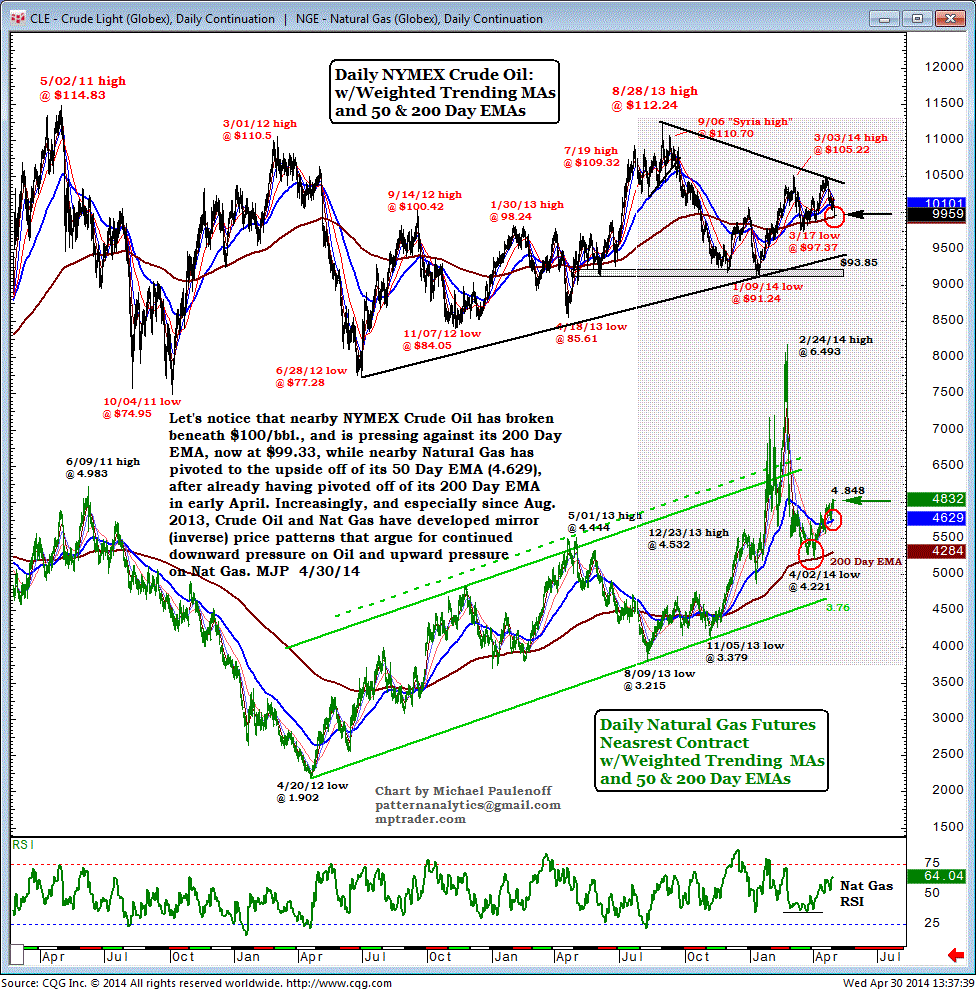
NYMEX Crude Oil vs. Natural Gas: Mirror Images?
Let's notice that nearby NYMEX Crude Oil has broken beneath $100/bbl, and is pressing against its 200-Day EMA, now at $99.33, while nearby Natural Gas has pivoted to the upside off of its 50-Day EMA (4.629), after already having pivoted off of its 200-Day EMA in early April.
Increasingly, and especially since Aug, 2013, Crude Oil and Natural Gas have developed mirror (inverse) price patterns that argue for continued downward pressure on oil and upward pressure on Natural Gas.

