Nasdaq at Start of Downside Correction
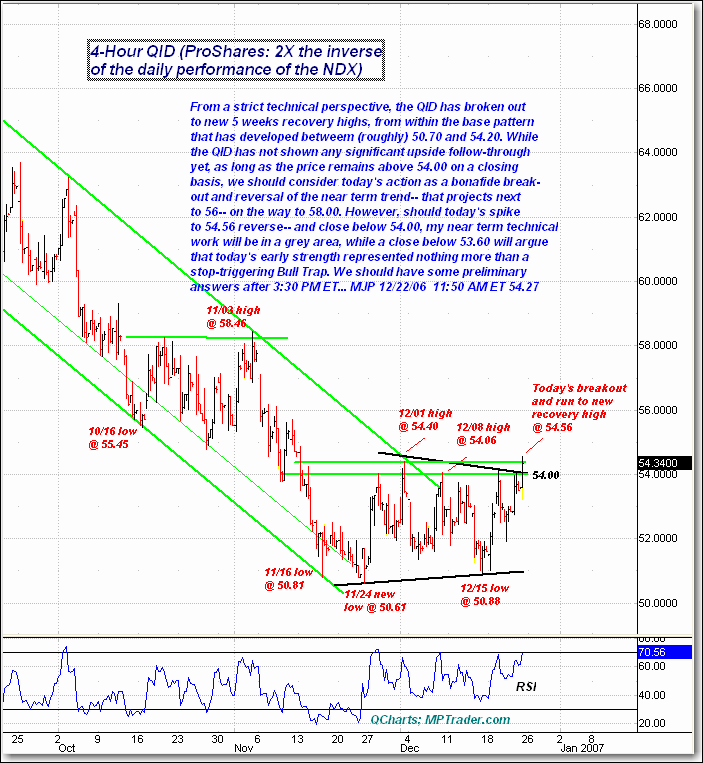
The QID chart is warning us that the Q's may be in the early stages of a very significant downside correction. From a strictly technical perspective the QID has broken out to new 5 week recovery highs from within the base pattern that has developed between (roughly) 50.70 and 54.20. While the QID has not shown any significant upside follow-through yet, as long as the price remains above 54 on a closing basis we should consider today's action as a bonafide breakout and reversal of the near-term trend -- that projects next to 56 on the way to 58. However, should today's spike to 54.56 reverse and close below 54, my near-term technical work will be in a gray area, while a close below 53.60 will argue that today's early strength represented nothing more than a stop-triggering bull trap. This will be our last Mid-Day Minute until after January 2, as we are on vacation next week. Happy Holidays and New Year.

