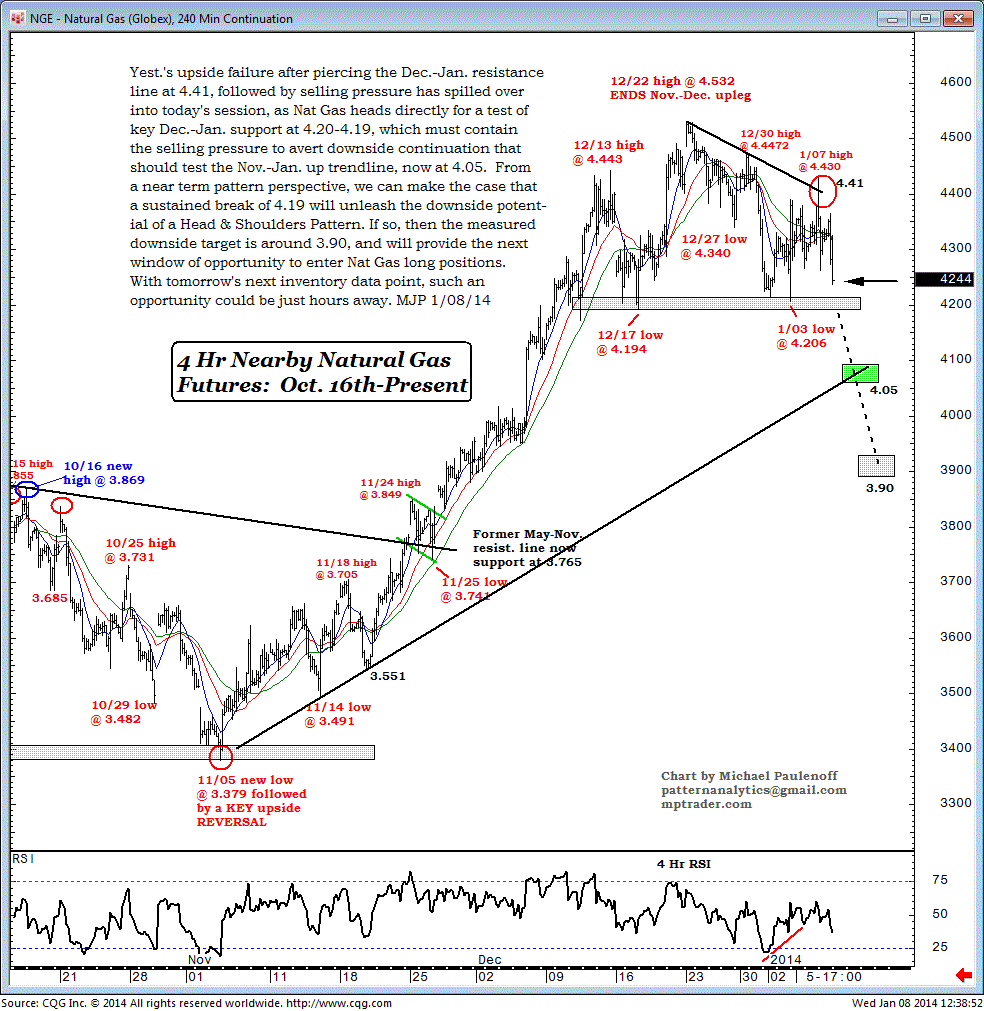
Natural Gas Heads for a Test of Significant Support
Yesterday's upside failure, after piercing the Dec-Jan resistance line at 4.41, followed by selling pressure, has spilled over into today's session, as Natural Gas heads directly for a test of key Dec-Jan support at 4.20-4.19, which must contain the selling pressure to avert downside continuation that should test the Nov-Jan up trendline, now at 4.05.
From a near-term pattern perspective, we can make the case that a sustained break of 4.19 will unleash the downside potential of a head and shoulder pattern.
If so, then the measured-downside target is around 3.90, and will provide the next window of opportunity to enter Natural Gas long positions.
With tomorrow's next inventory-data point, such an opportunity could be just hours away.