Near-Term Correction Ahead of Another Upleg
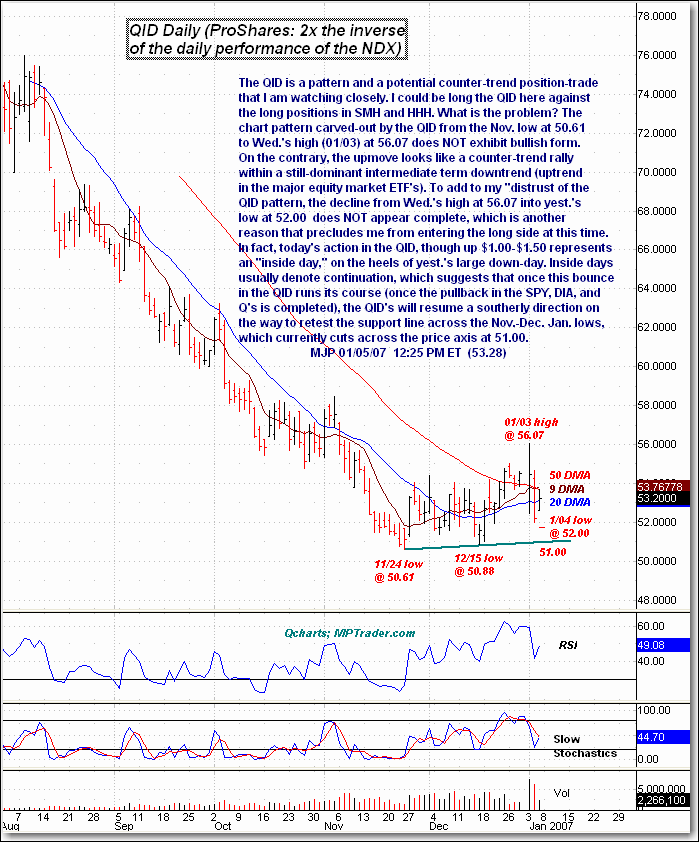
The QID is a pattern and potential counter-trend position-trade that I am watching closely. I could be long the QID here against the long positions in SMH and HHH. What is the problem? The chart pattern carved out by the QID from the Nov. low at 50.61 to Wednesday's high (01/03) at 56.07 does not exhibit bullish form. On the contrary, the upmove looks like a counter-trend rally within a still-dominant intermediate-term downtrend (uptrend in the major equity market ETFs).
To add to my "distrust" of the QID pattern, the decline from Wed's high at 56.07 into yesterday's low at 52 does not appear complete, which is another reason that precludes me from entering the long side at this time. In fact, today's action in the QID, though up $1-$1.50, represents an "inside day" on the heels of yesterday's large down-day. Inside days usually denote continuation, which suggests that once this bounce in the QID runs its course (once the pullback in the SPY, DIA and Q's is completed), the QIDs will resume a southerly direction on the way to retest the support line across the Nov-Dec and Jan lows, which currently cuts across the price axis at 51.

