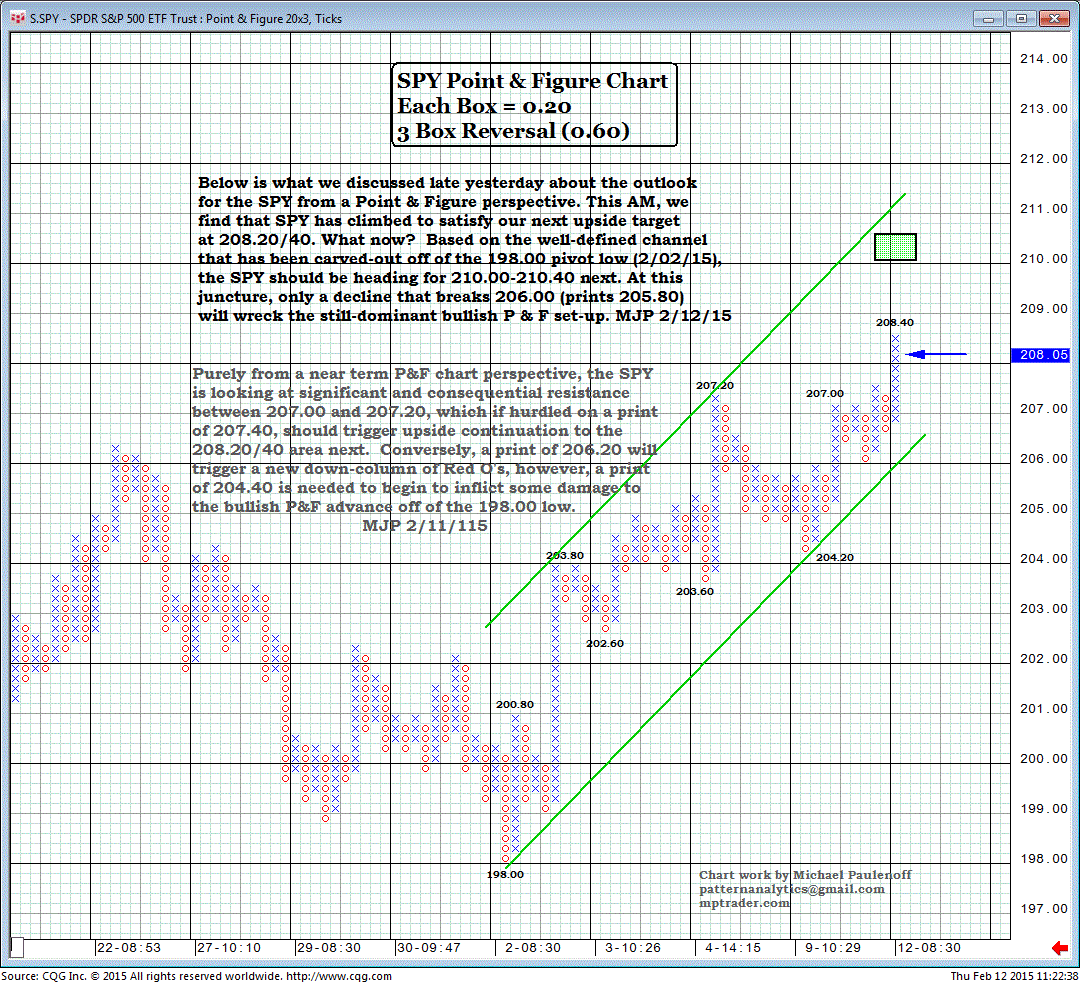
Near-Term P&F Chart Points Still-Higher for SPY
Below is what we discussed late yesterday about the outlook for the SPY from a Point & Figure perspective. This morning, we find that the SPY has climbed to satisfy our next upside target at 208.20/40.
What now?
Based on the well-defined channel that has been carved-out off of the 198.00 pivot low on Feb 2, the SPY should be heading for 210.00-210.40 next.
At this juncture, only a decline that breaks 206.00 (prints 205.80) will wreck the still-dominant bullish P & F set-up. MJP 2/12/15
Purely from a near-term P&F chart perspective, the SPY is looking at significant and consequential resistance between 207.00 and 207.20, which, if hurdled on a print of 207.40, should trigger upside continuation to the 208.20/40 area next.
Conversely, a print of 206.20 will trigger a new down-column of Red O's, however, a print of 204.40 is needed to begin to inflict some damage to the bullish P&F advance off of the 198.00 low. MJP 2/11/115

