Oil Bounces off of $48.00, but is the Correction Over?
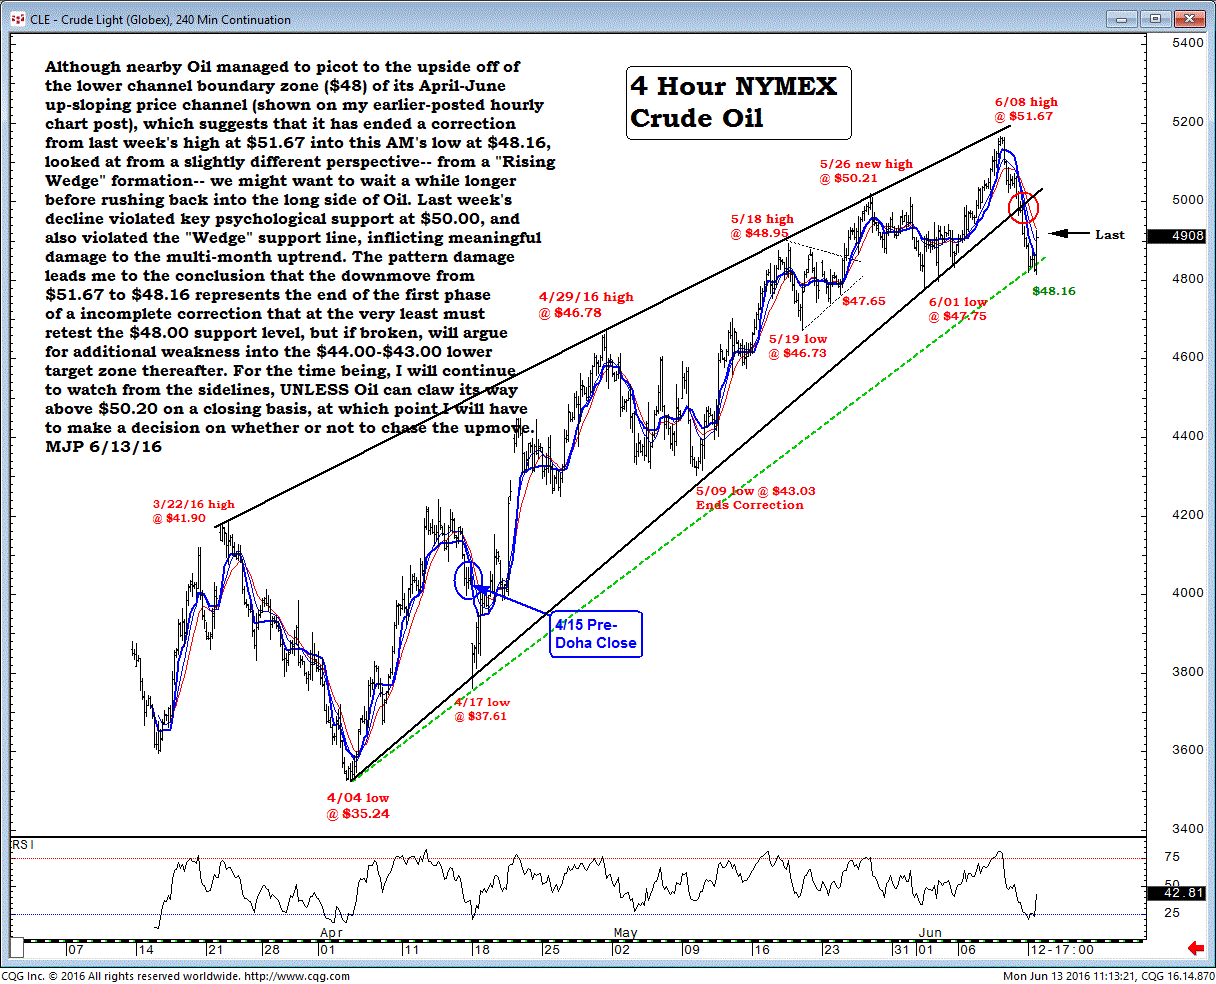
Although nearby Oil managed to pivot to the upside off of the lower-channel boundary zone ($48) of its April-June up-sloping price channel (shown on my earlier-posted hourly chart post), which suggests that it has ended a correction from last week's high at $51.67 into this morning's low at $48.16, looked at from a slightly different perspective-- from a "Rising Wedge" formation-- we might want to wait a while longer before rushing back into the long side of Oil.
Last week's decline violated key psychological support at $50.00, and also violated the "Wedge" support line, inflicting meaningful damage to the multi-month uptrend.
The pattern damage leads me to the conclusion that the down move from $51.67 to $48.16 represents the end of the first phase of a incomplete correction that at the very least must retest the $48.00 support level, but if broken, will argue for additional weakness into the $44.00-$43.00 lower target zone thereafter.
For the time being, I will continue to watch from the sidelines, unless Oil can claw its way above $50.20 on a closing basis, at which point I will have to make a decision on whether or not to chase the up move.

