Oil Chart Bullish - Market Analysis for Nov 4th, 2008

Oil Chart Bullish
By Mike Paulenoff, www.MPTrader.com

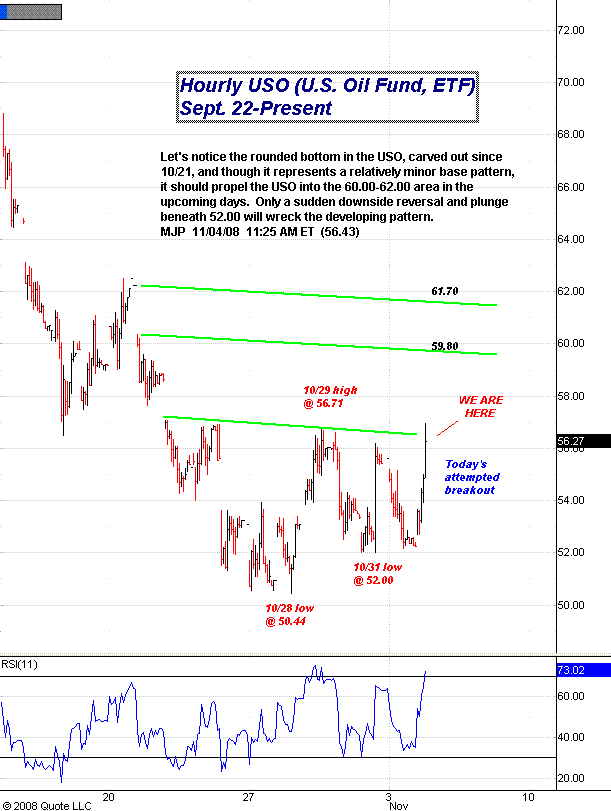
Let's notice the rounded bottom in the U.S. Oil Fund ETF (AMEX: USO), carved out since Oct 21, and though it represents a relatively minor base pattern, it should propel the USO into the 60.00-62.00 area in the upcoming days. Only a sudden downside reversal and plunge beneath 52.00 will wreck the developing pattern.


  Matched
x
  • Action-Oriented Trade Set-Ups in Stocks & ETFs
  • Macro Analysis of the Broader Markets
  • Detailed Technical Guidance for each Trading Idea
  • Live Interaction w/ Mike & Our Member Community
  • And Much, Much More!
Join Now! - Special Offer!
Veteran Wall Street analyst and financial author, Mike provides detailed and timely analysis and trade set-ups on a range of markets. Read more...

Have Mike's “Out Front” morning analysis delivered FREE to your email inbox twice weekly!