Oil Still Cannot Catch a Sustainable Bid

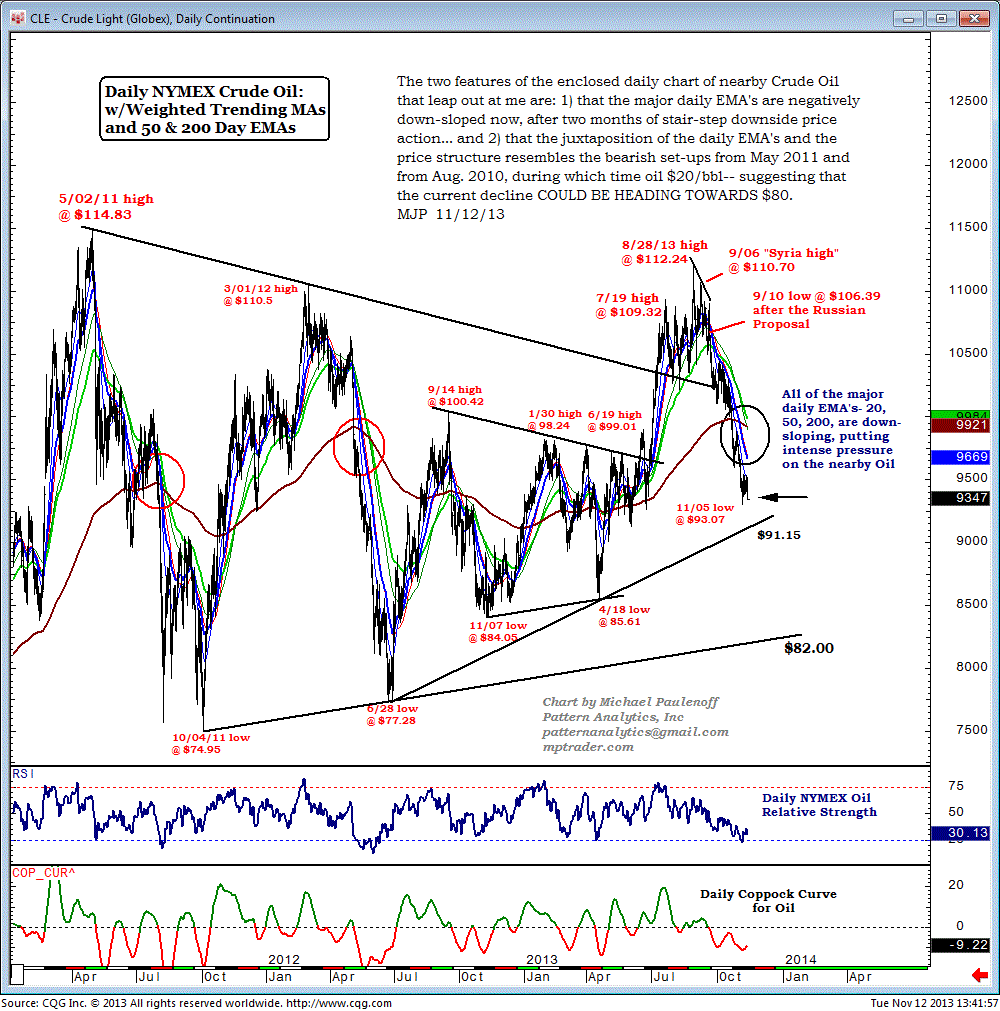
The two features of the daily chart of nearby Crude Oil that leap out at me are:

1) that the major daily EMA's are negatively down-sloped now, after two months of stair-step   downside price action, and

2) that the juxtaposition of the daily EMA's and the price structure resembles the bearish set-ups from May 2011 and Aug 2010, during which time oil $20/bbl, suggesting that the current decline could be heading towards $80.

  Matched
x
  • Action-Oriented Trade Set-Ups in Stocks & ETFs
  • Macro Analysis of the Broader Markets
  • Detailed Technical Guidance for each Trading Idea
  • Live Interaction w/ Mike & Our Member Community
  • And Much, Much More!
Join Now! - Special Offer!
Veteran Wall Street analyst and financial author, Mike provides detailed and timely analysis and trade set-ups on a range of markets. Read more...

Have Mike's “Out Front” morning analysis delivered FREE to your email inbox twice weekly!