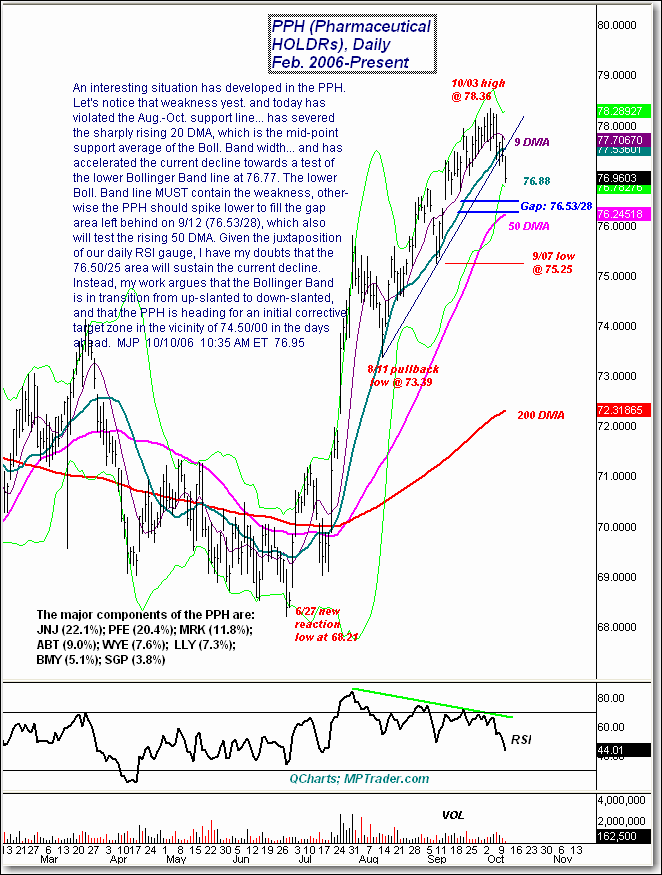
Pharmaceuticals (PPH) in Decline
From 4:16 pm EDT
By Mike Paulenoff, MPTrader.com (www.mptrader.com)
It seems that just about every asset class at some point in its recent overbought condition has managed to correct its excesses--- except in the equity averages. Lately, the bond market has pulled back significantly, and prior to the bonds, oil and gold. At some point, now that everyone is enamored with equities, they too will feel the effects of gravitational pull.
Let's look at the Nasdaq 100, through its tracking stock, the QQQQ. Tuesday was the Q's fourth session circling the 41.30/80 area, which exhibits technical characteristics of "peak" on my hourly charts, but not yet on the enclosed daily chart.
Let's notice that during the intermediate-term top-building process that occurred between January and May, the Q's carved out a formidable sideways (now resistance) plateau between 41.25 and 42.60, which the current upmove is attempting to "chew through," as we speak.
It seems to me that given the unimpressive volume "expansion" recently, coupled with the stall in momentum (just beneath the overbought plateau), that the Q's will be hard-pressed to make much headway to the upside in the effort to hurdle the heavy Jan-May resistance plateau.
On the other hand, the stair-step uptrend off of the July lows into today's high has NOT (yet) had one pullback that has broken beneath a significant prior pullback low, which is needed to break the back of the uptrend.
At this juncture, the Q's need to break 41.20 to inflict initial damage to the uptrend. Right now my work indicates that we stay positioned short for the conclusion of the nearest-term portion of the upmove off of the 10/03 low at 39.88, which could present itself at just about any moment now.

Mike Paulenoff is author of the MPTrader.com ETF Trading Diary (www.mptrader.com), a real-time diary of his technical analysis on equity markets, futures, metals, currencies and Treasuries.
Pharmaceuticals (PPH) in Decline
From 10:35 am EDT
By Mike Paulenoff, MPTrader.com (www.mptrader.com)
An interesting situation has developed in the PPH. Let's notice that weakness yest. and today has violated the Aug.-Oct. support line... has severed the sharply rising 20 DMA, which is the mid-point support average of the Boll. Band width... and has accelerated the current decline towards a test of the lower Bollinger Band line at 76.77. The lower Boll. Band line MUST contain the weakness, other- wise the PPH should spike lower to fill the gap area left behind on 9/12 (76.53/28), which also will test the rising 50 DMA. Given the juxtaposition of our daily RSI gauge, I have my doubts that the 76.50/25 area will sustain the current decline. Instead, my work argues that the Bollinger Band is in transition from up-slanted to down-slanted, and that the PPH is heading for an initial corrective target zone in the vicinity of 74.50/00 in the days ahead. MJP 10/10/06 10:35 AM ET 76.95
For more of Mike Paulenoff, sign up for a Free 15-Day Trial -- PLUS 1/2 OFF to his ETF Trading Diary.

