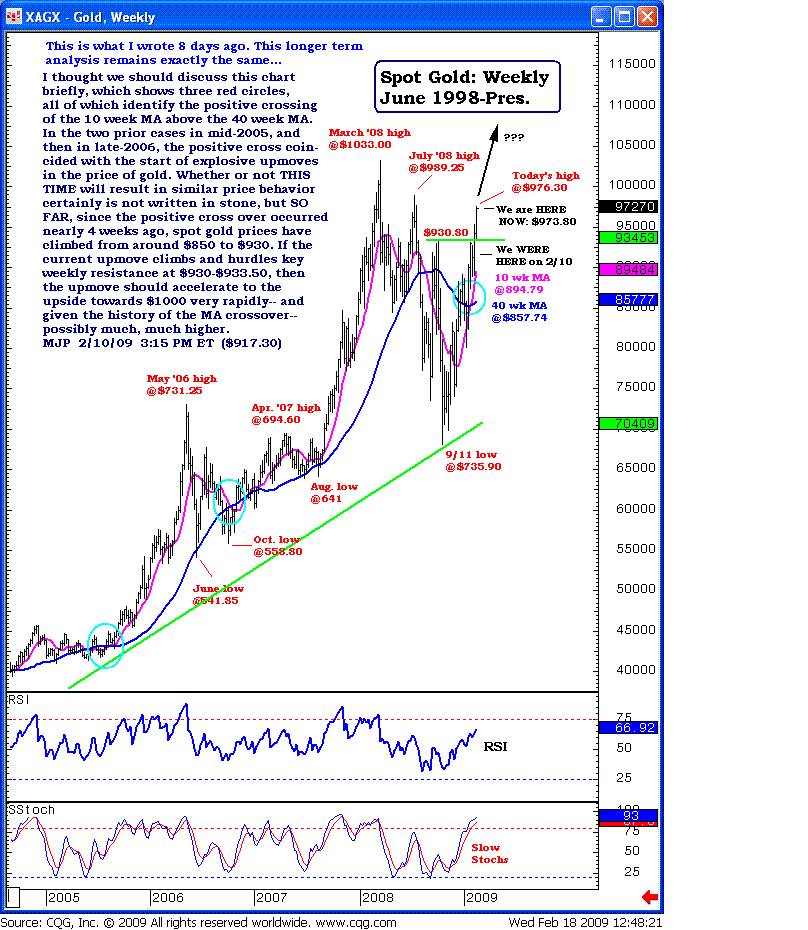
Positive Crossover in Gold
By Mike Paulenoff, www.MPTrader.com
The overriding reason for re-entering the SPDR Gold Trust ETF (NYSE: GLD) "up HERE" in our model portfolio is derived from my intermediate-longer term technical work, which we discussed last week. Eight days ago I noted the big-picture pattern of spot gold for subscribers, and the longer-term analysis on that weekly chart remains exactly the same today. The chart shows three red circles, all of which identify the positive crossing of the 10-week moving average above the 40-week MA. In the two prior cases in mid 2005 and then in late 2006, the positive cross coincided with the start of explosive upmoves in the price of gold. Whether or not this time will result in similar price behavior certainly is not written in stone, but so far since the positive crossover occurred nearly 4 weeks ago, spot gold prices have climbed from around $850 to $930. If the current upmove climbs and hurdles key weekly resistance at $930-933.50, then the upmove should accelerate to the upside towards $1000 very rapidly -- and given the history of the moving average crossover, possibly much, much higher.

