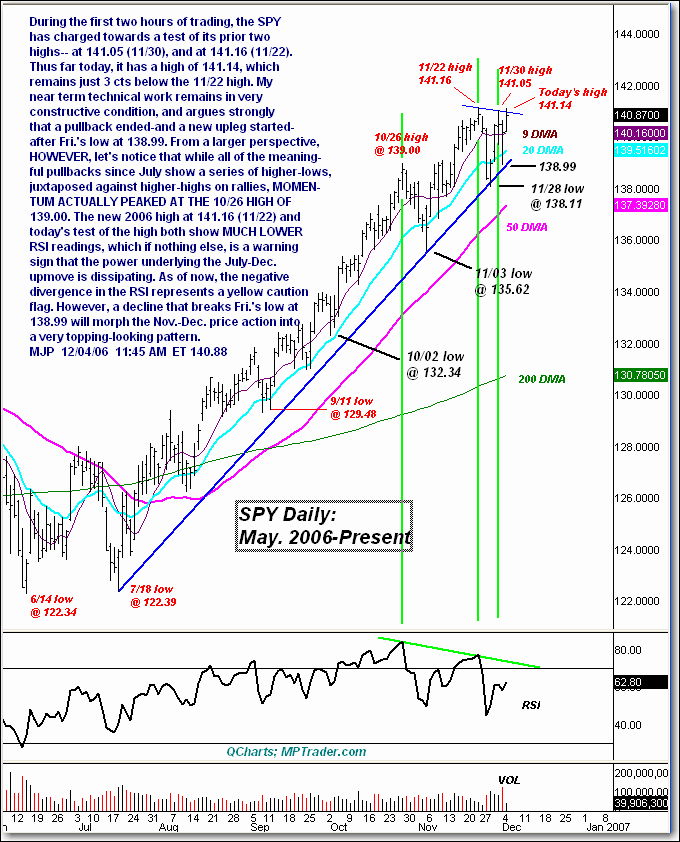
Pullback Ended in S&P 500
From a larger perspective, however, let's notice that while all of the meaningful pullbacks since July show a series of higher-lows, juxtaposed against higher-highs on rallies, momentum actually peaked at the 10/26 high of 139. The 2006 high at 141.16 (11/22) and today's test of the high both show much lower RSI readings, which if nothing else is a warning sign that the power underlying the July-December upmove is dissipating.
As of now, the negative divergence in the RSI represents a yellow caution flag. However, a decline that breaks Friday's low at 138.99 will morph the Nov-Dec price action into a very topping-looking pattern.

