Qs Angle of Ascent Steeper with Each Up-Leg

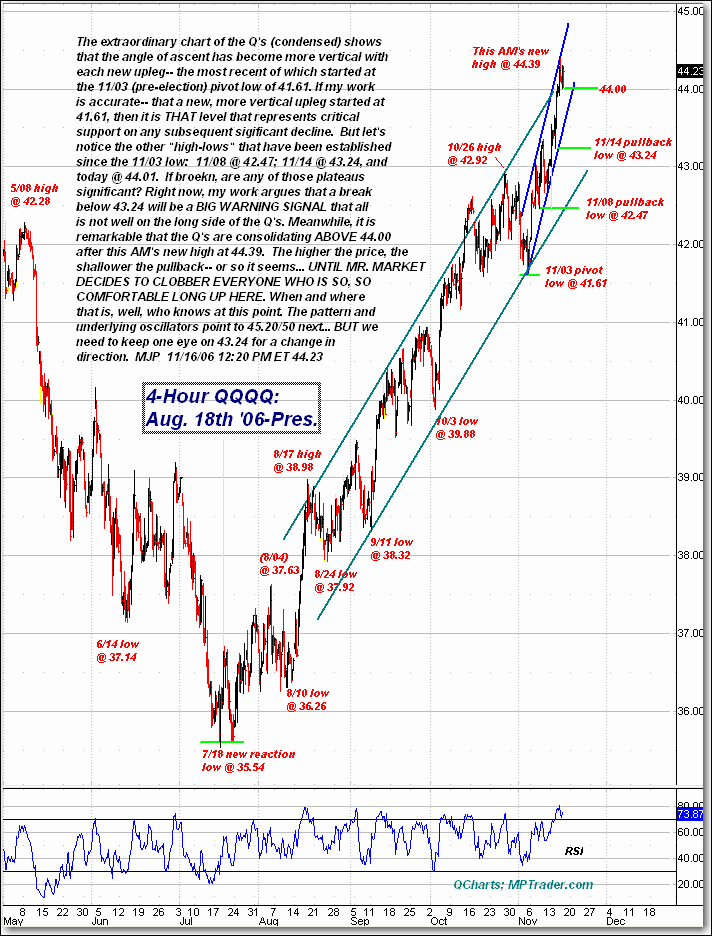
The extraordinary chart of the Q's (condensed) shows that the angle of ascent has become more vertical with each new upleg, the most recent of which started at the 11/03 (pre-election) pivot low of 41.61. If my work is accurate -- that a new, more vertical upleg started at 41.61 -- then it is THAT level that represents critical support on any subsequent sigificant decline.

But let's notice the other "high-lows" that have been established since the 11/03 low: 11/08 @ 42.47; 11/14 @ 43.24, and today @ 44.01. If broken, are any of those plateaus significant? Right now, my work argues that a break below 43.24 will be a BIG WARNING SIGNAL that all is not well on the long side of the Q's.

Meanwhile, it is remarkable that the Q's are consolidating ABOVE 44.00 after this AM's new high at 44.39. The higher the price, the shallower the pullback, or so it seems ... UNTIL MR. MARKET DECIDES TO CLOBBER EVERYONE WHO IS SO, SO COMFORTABLE LONG UP HERE. When and where that is, well, who knows at this point. The pattern and underlying oscillators point to 45.20/50 next. BUT we need to keep one eye on 43.24 for a change in direction.

  Matched
x
  • Action-Oriented Trade Set-Ups in Stocks & ETFs
  • Macro Analysis of the Broader Markets
  • Detailed Technical Guidance for each Trading Idea
  • Live Interaction w/ Mike & Our Member Community
  • And Much, Much More!
Join Now! - Special Offer!
Veteran Wall Street analyst and financial author, Mike provides detailed and timely analysis and trade set-ups on a range of markets. Read more...

Have Mike's “Out Front” morning analysis delivered FREE to your email inbox twice weekly!