Q's Breaking Down?
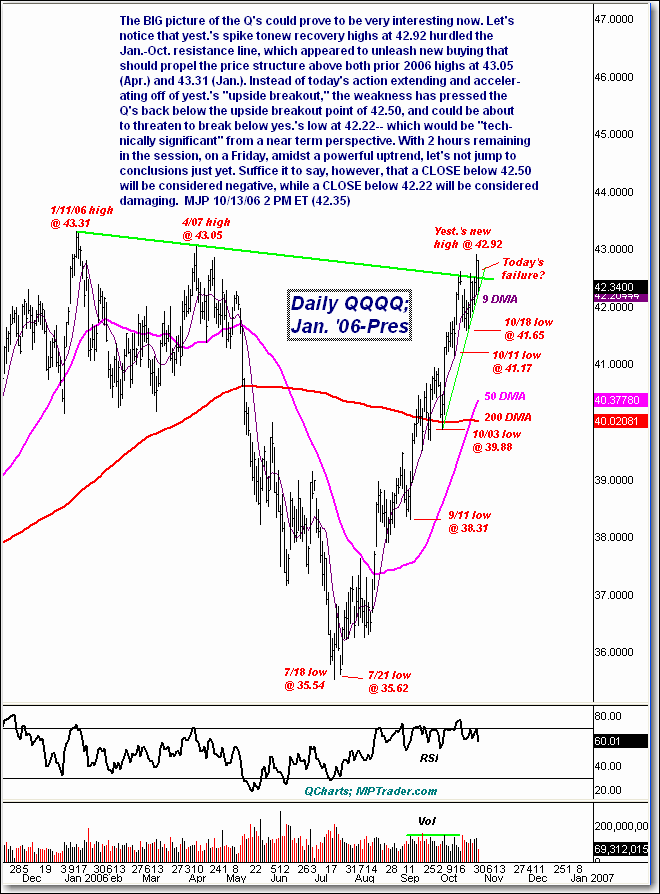
The BIG picture of the Q's could prove to be very interesting now. Let's
notice that yest.'s spike tonew recovery highs at 42.92 hurdled the
Jan.-Oct. resistance line, which appeared to unleash new buying that
should propel the price structure above both prior 2006 highs at 43.05
(Apr.) and 43.31 (Jan.). Instead of today's action extending and acceler-
ating off of yest.'s "upside breakout," the weakness has pressed the
Q's back below the upside breakout point of 42.50, and could be about
to threaten to break below yes.'s low at 42.22-- which would be "tech-
nically significant" from a near term perspective. With 2 hours remaining
in the session, on a Friday, amidst a powerful uptrend, let's not jump to
conclusions just yet. Suffice it to say, however, that a CLOSE below 42.50
will be considered negative, while a CLOSE below 42.22 will be considered
damaging. MJP 10/13/06 2 PM ET (42.35)

