Qs Confined! - Market Analysis for Jan 26th, 2006
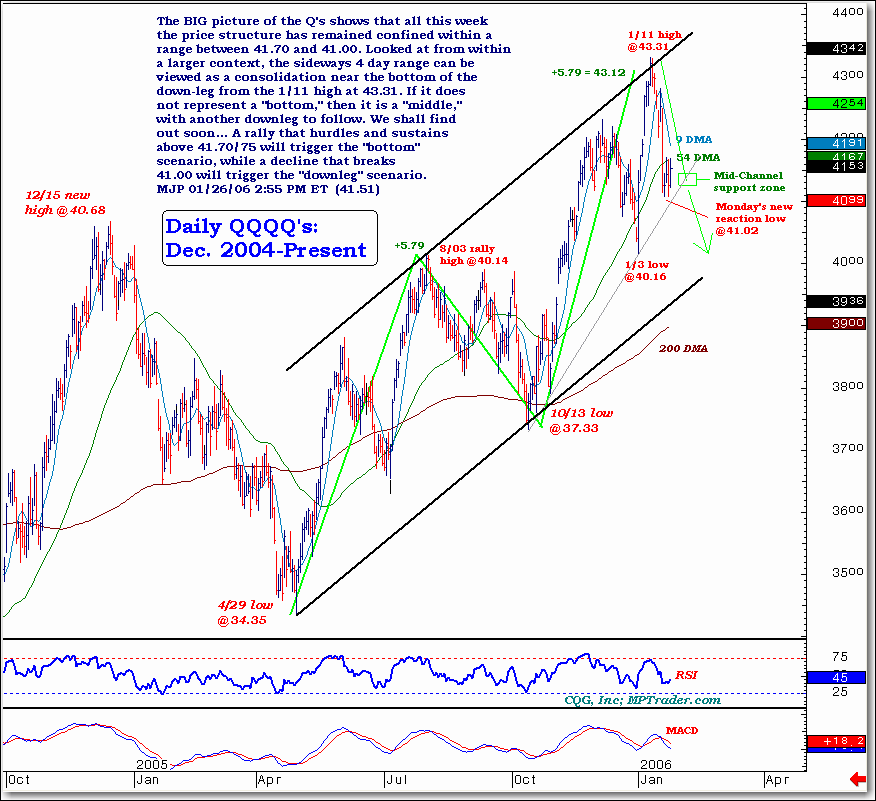
The BIG picture of the Q's shows that all this week
the price structure has remained confined within a
range between 41.70 and 41.00. Looked at from within
a larger context, the sideways 4 day range can be
viewed as a consolidation near the bottom of the
down-leg from the 1/11 high at 43.31. If it does
not represent a "bottom," then it is a "middle,"
with another downleg to follow. We shall find
out soon... A rally that hurdles and sustains
above 41.70/75 will trigger the "bottom"
scenario, while a decline that breaks
41.00 will trigger the "downleg" scenario.
MJP 01/26/06 2:55 PM ET (41.51)
For more of Mike Paulenoff, sign up for a Free 15-Day Trial to his Macro Trading Charts. Or try his QQQ Trading Charts or his E-mini S&P 500 Trading Diary.

