
S&P 500 (SPX) Chart Remains Healthy
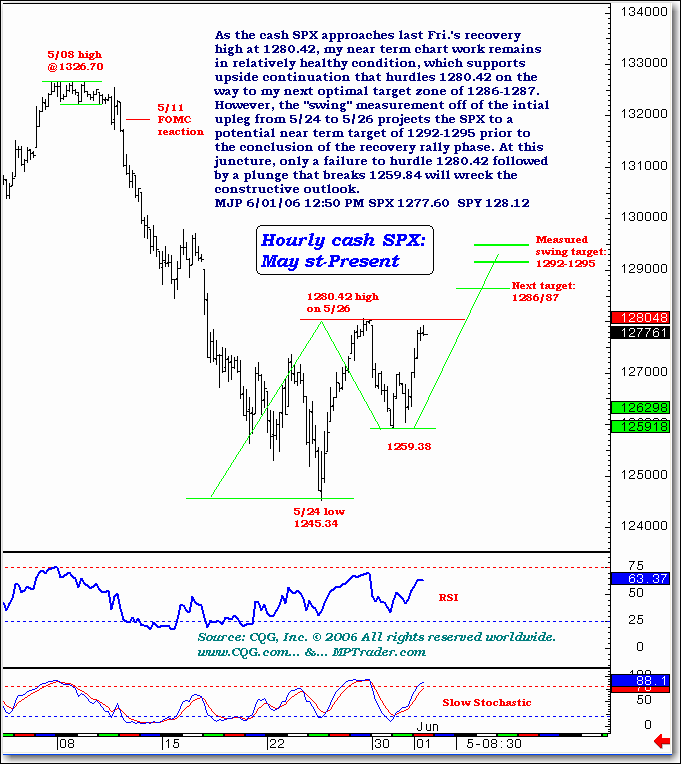
As the cash SPX approaches last Fri.'s recovery
high at 1280.42, my near term chart work remains
in relatively healthy condition, which supports
upside continuation that hurdles 1280.42 on the
way to my next optimal target zone of 1286-1287.
However, the "swing" measurement off of the intial
upleg from 5/24 to 5/26 projects the SPX to a
potential near term target of 1292-1295 prior to
the conclusion of the recovery rally phase. At this
juncture, only a failure to hurdle 1280.42 followed
by a plunge that breaks 1259.84 will wreck the
constructive outlook.
MJP 6/01/06 12:50 PM SPX 1277.60 SPY 128.12
For more of Mike Paulenoff, sign up for a Free 15-Day Trial to his new ETF Trading Diary -- a combination of his diary services.