S&P 500 (SPX) in Minor Relief Rally?
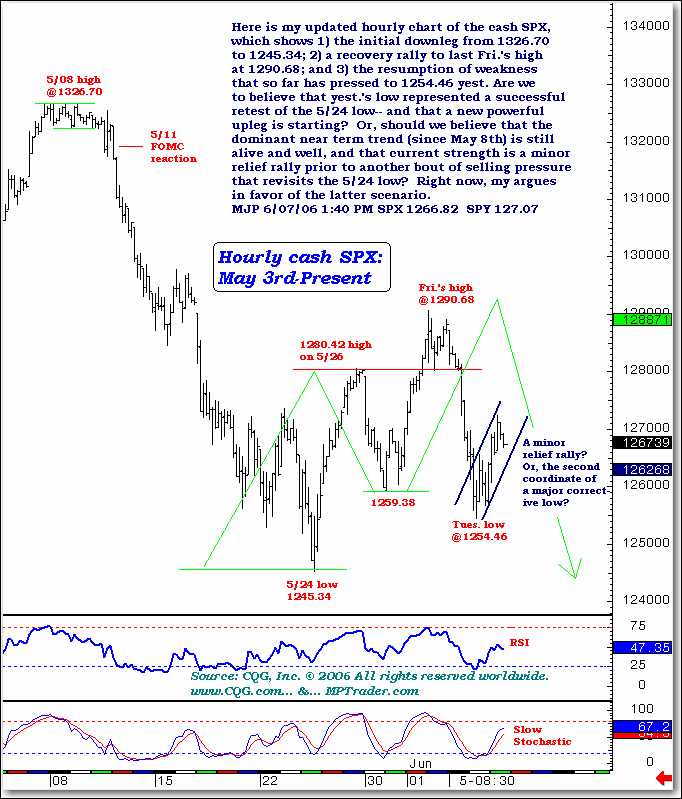
Here is my updated hourly chart of the cash SPX,
which shows 1) the initial downleg from 1326.70
to 1245.34; 2) a recovery rally to last Fri.'s high
at 1290.68; and 3) the resumption of weakness
that so far has pressed to 1254.46 yest. Are we
to believe that yest.'s low represented a successful
retest of the 5/24 low-- and that a new powerful
upleg is starting? Or, should we believe that the
dominant near term trend (since May 8th) is still
alive and well, and that current strength is a minor
relief rally prior to another bout of selling pressure
that revisits the 5/24 low? Right now, my work argues
in favor of the latter scenario.
For more of Mike Paulenoff, sign up for a Free 15-Day Trial to his new ETF Trading Diary -- a combination of his diary services.

