SPH-- A Sharp Oversold Recovery Rally, or Something More Bullish?
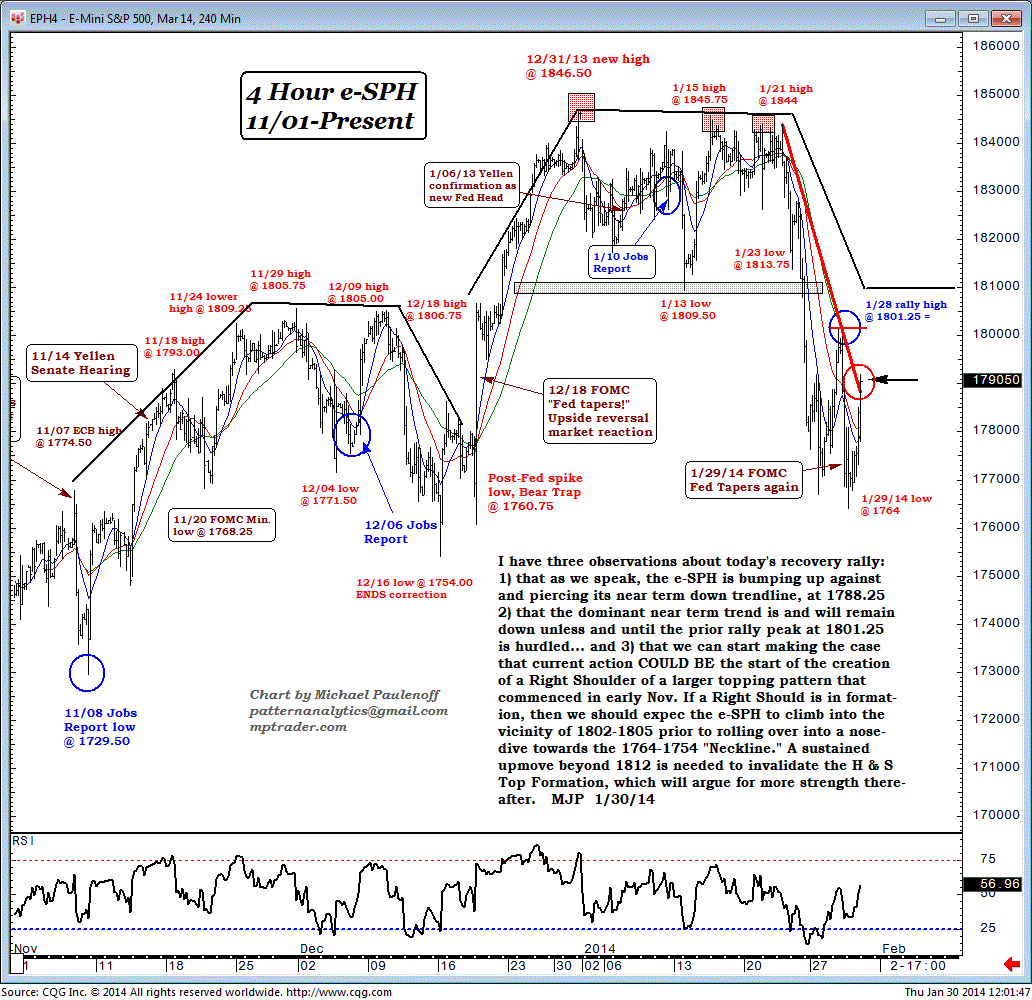
I have three observations about today's recovery rally:
1) that as we speak, the e-SPH is bumping up against and piercing its near-term down trendline, at 1788.25;
2) that the dominant near-term trend is and will remain down unless and until the prior rally peak at 1801.25 is hurdled; and
3) that we can start making the case that current action could be the start of the creation of a right shoulder of a larger topping pattern that commenced in early Nov.
If a right should is in formation, then we should expect the e-SPH to climb into the vicinity of 1802-1805 prior to rolling over into a nosedive towards the 1764-1754 "neckline."
A sustained upmove beyond 1812 is needed to invalidate the H&S top formation, which will argue for more strength thereafter.