SPX Warning Signal - Market Analysis for Oct 16th, 2013
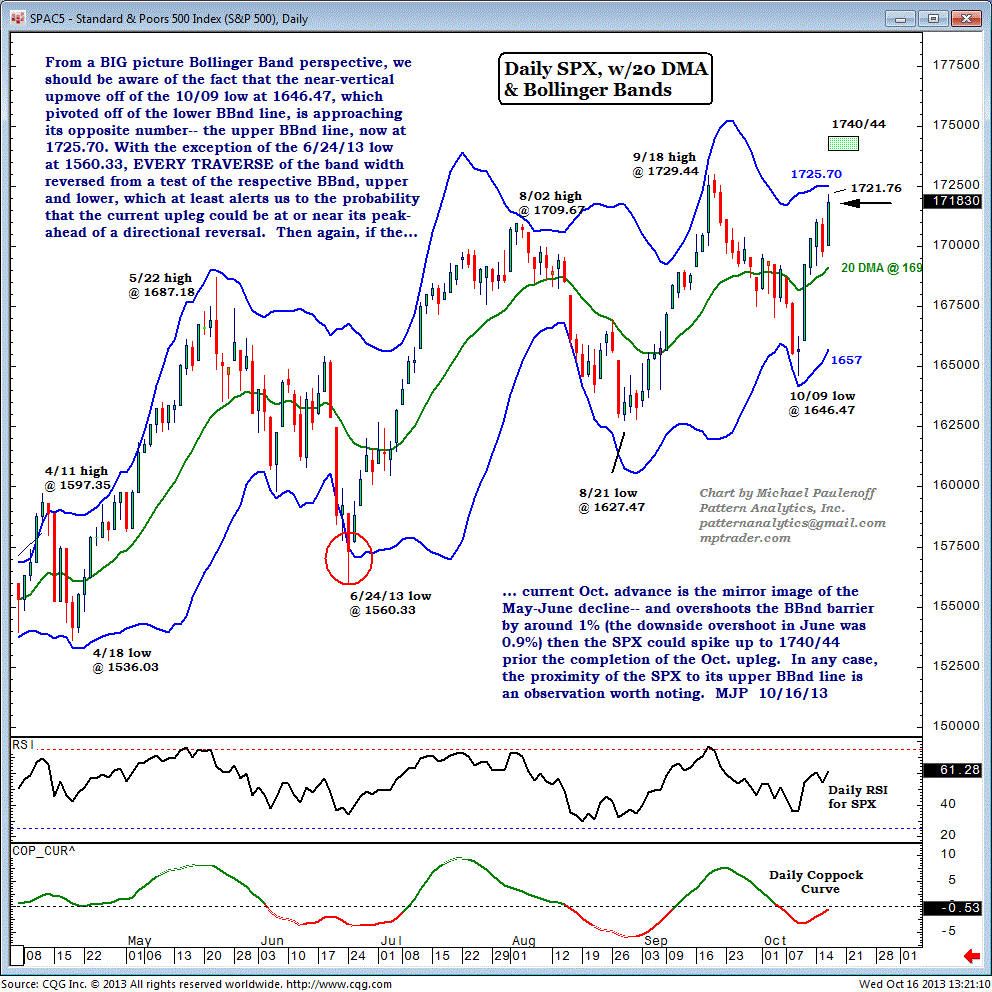
From a big-picture Bollinger Bands ® perspective, we should be aware of the fact that the near-vertical upmove off of the Oct 9 low at 1646.47, which pivoted off of the lower Bollinger Bands line, is approaching its opposite number-- the upper Bollinger Bands line, now at 1725.70.
With the exception of the June 24 low at 1560.33, every traverse of the band width reversed from a test of the respective Bollinger Bands, upper and lower, which at least alerts us to the probability that the current upleg could be at or near its peak ahead of a directional reversal.
Then again, if the current Oct advance is the mirror image of the May-June decline, and overshoots the Bollinger Bands barrier by around 1% (the downside overshoot in June was 0.9%), then the SPX could spike up to 1740/44 prior the completion of the Oct upleg.
In any case, the proximity of the S&P 500 Index (SPX) to its upper Bollinger Bands line is an observation worth noting.