SPY Not as Healthy As Today's Early Rally Might Suggest
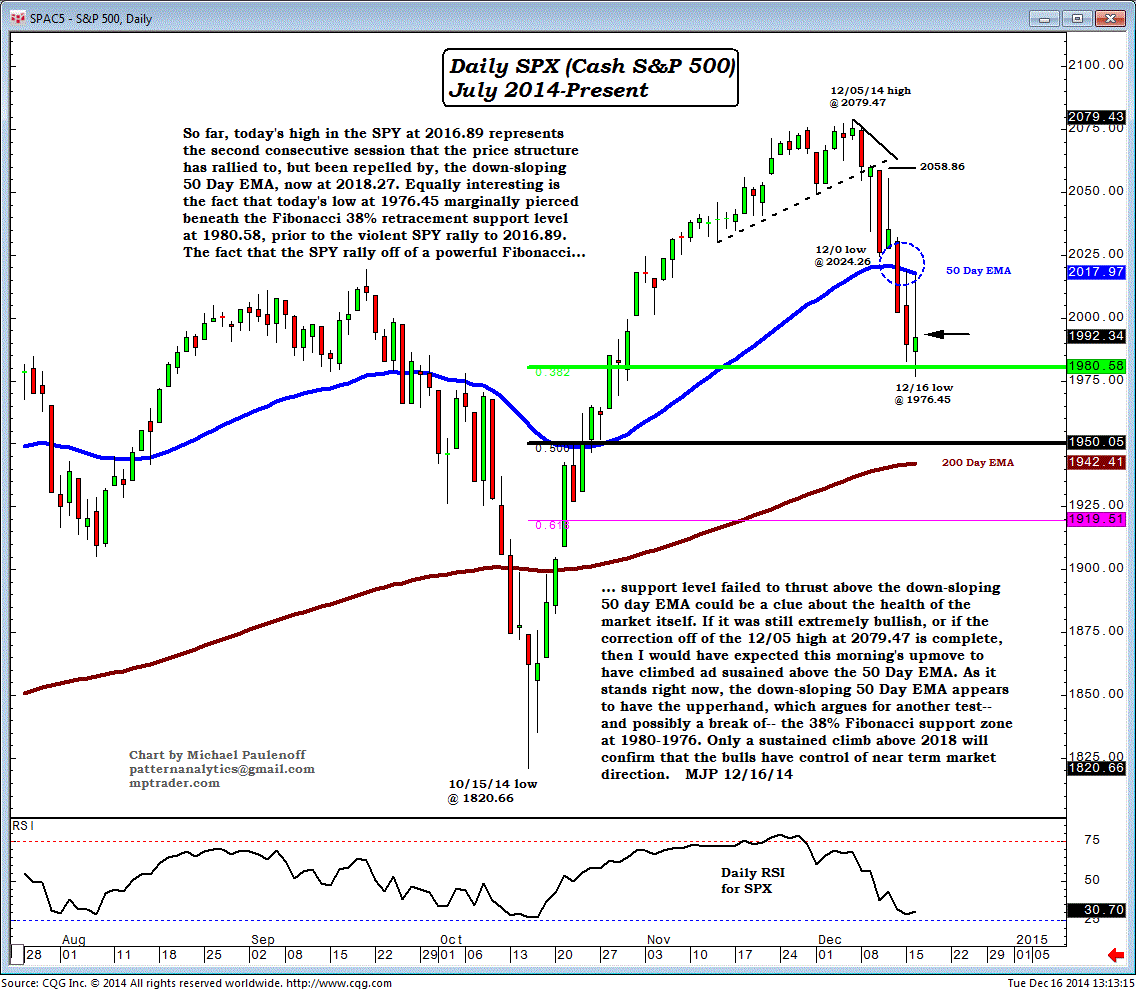
So far, today's high in the SPY at 2016.89 represents the second consecutive session that the price structure has rallied to, but been repelled by, the down-sloping 50-Day EMA, now at 2018.27.
Equally interesting is the fact that today's low at 1976.45 marginally pierced beneath the Fibonacci 38% retracement support level at 1980.58, prior to the violent SPY rally to 2016.89.
The fact that the SPY rallied off of a powerful Fibonacci support level failed to thrust above the down-sloping 50-day EMA could be a clue about the health of the market itself.
If it was still extremely bullish, or if the correction off of the Dec 5 high at 2079.47 is complete, then I would have expected this morning's upmove to have climbed and sustained above the 50-Day EMA.
As it stands right now, the down-sloping 50-Day EMA appears to have the upper hand, which argues for another test-- and possibly a break of-- the 38% Fibonacci support zone at 1980-1976.
Only a sustained climb above 2018 will confirm that the bulls have control of near-term direction.

