SPY P&F Charts Say Ignore the Weakness (For Now)
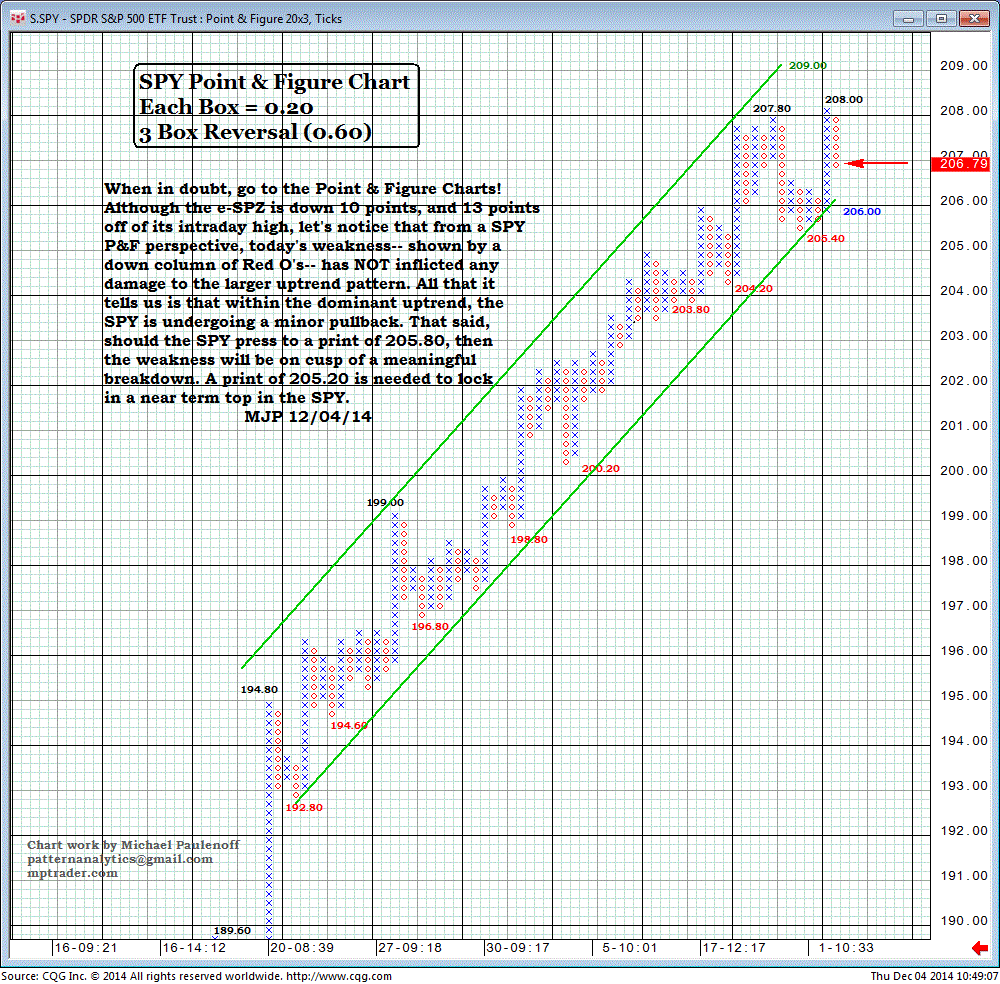
When in doubt, go to the Point & Figure Charts!
Although the e-SPZ is down 10 points, and 13 points off of its intraday high, let's notice that from a SPDR S&P 500 (SPY) P&F perspective, today's weakness-- shown by a down column of Red O's-- has not inflicted any damage to the larger uptrend pattern.
All that it tells us is that within the dominant uptrend, the SPY is undergoing a minor pullback.
That said, should the SPY press to a print of 205.80, then the weakness will be on cusp of a meaningful breakdown.
A print of 205.20 is needed to lock in a near-term top in the SPY.