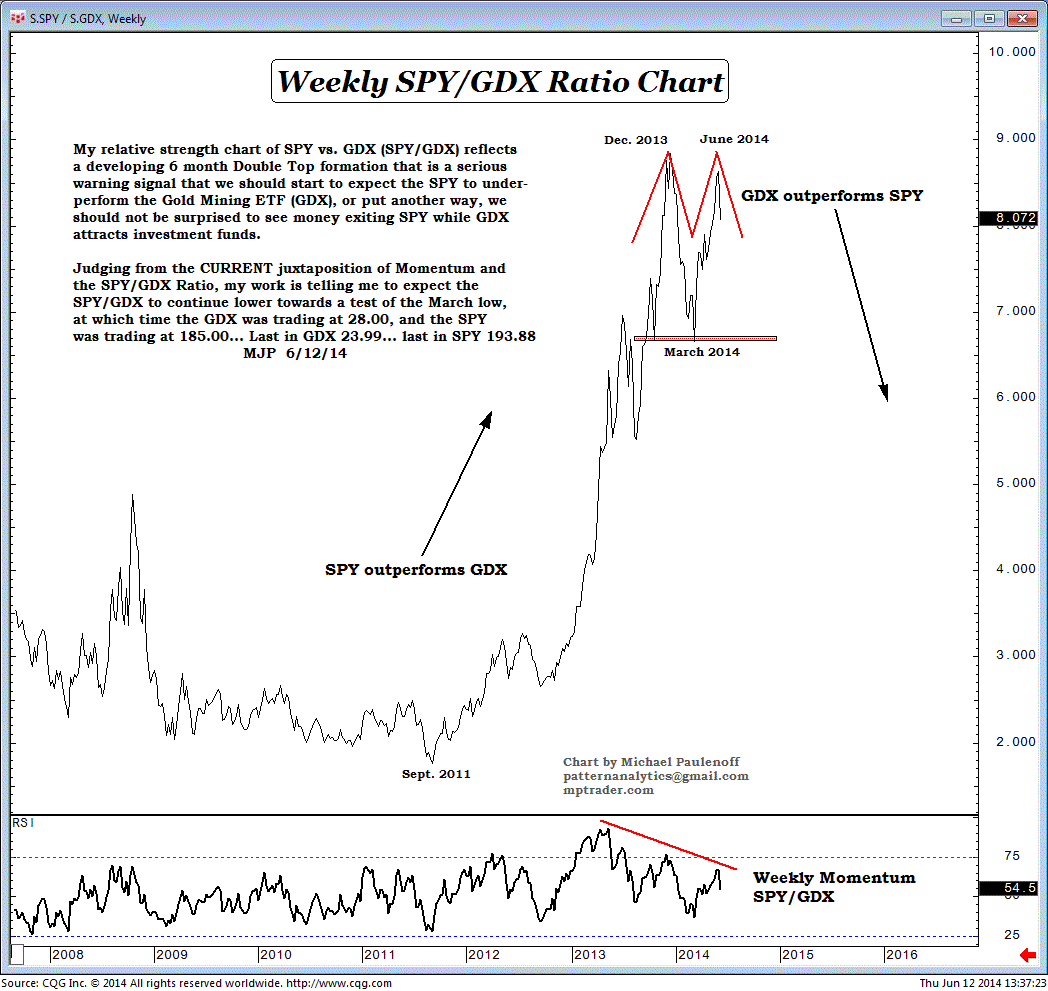
SPY vs. GDX Relative Strength Shifting in Favor of The Gold Miners
My relative strength chart of SPDR S&P 500 (SPY) vs. Market Vectors Gold Miners ETF (GDX) (SPY/GDX) reflects a developing 6 month Double Top formation that is a serious warning signal that we should start to expect the SPY to underperform the GDX, or put another way, we should not be surprised to see money exiting SPY while GDX attracts investment funds.
Judging from the current juxtaposition of momentum, and the SPY/GDX Ratio, my work is telling me to expect the SPY/GDX to continue lower towards a test of the March low, at which time the GDX was trading at 28.00, and the SPY was trading at 185.00... last in GDX 23.99... last in SPY 193.88.

