Signs of Stabilization in Spot Gold
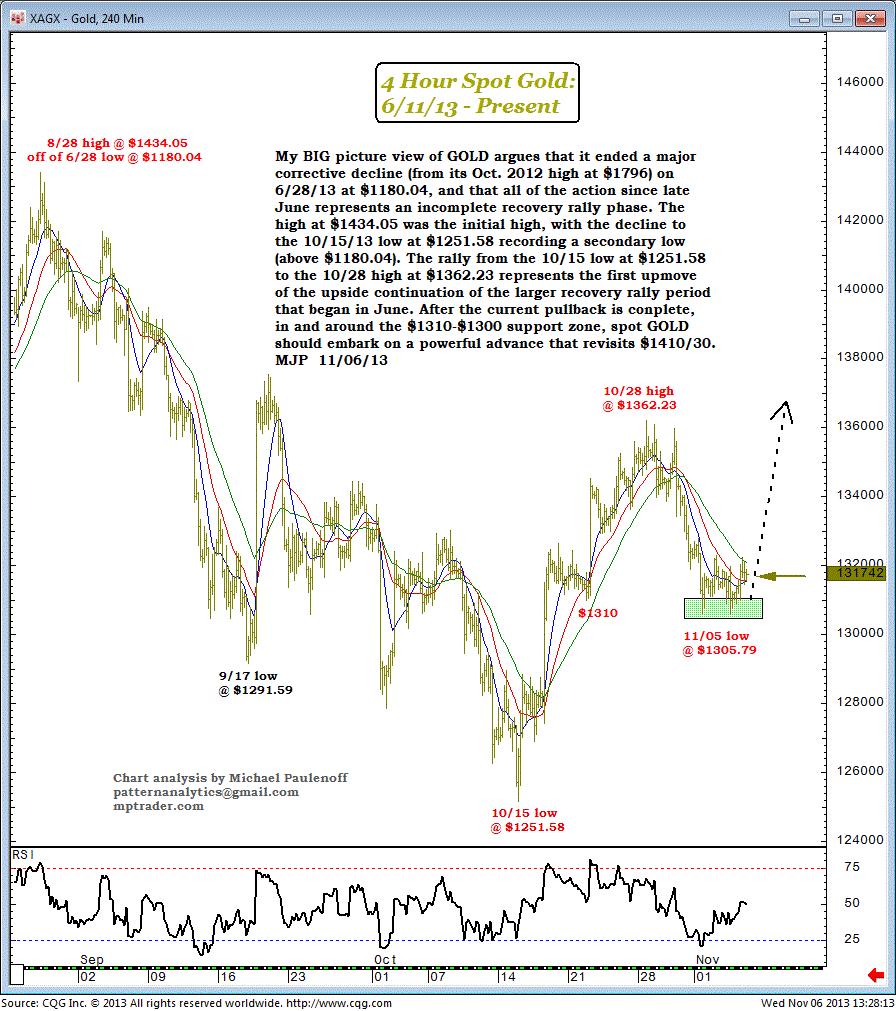
My big picture view of Gold argues that it ended a major corrective decline from its Oct 2012 high at $1796 on June 28, 2013 at $1180.04, and that all of the action since late June represents an incomplete recovery-rally phase.
The high at $1434.05 was the initial high, with the decline to the Oct 15, 2013 low at $1251.58 recording a secondary low above $1180.04.
The rally from the Oct 15 low at $1251.58 to the Oct 28 high at $1362.23 represents the first upmove of the upside continuation of the larger recovery-rally period that began in June.
After the current pullback is complete, in and around the $1310-$1300 support zone, spot Gold should embark on a powerful advance that revisits $1410/30.

