So far, The Recovery Rally in ES is Lacking Umph
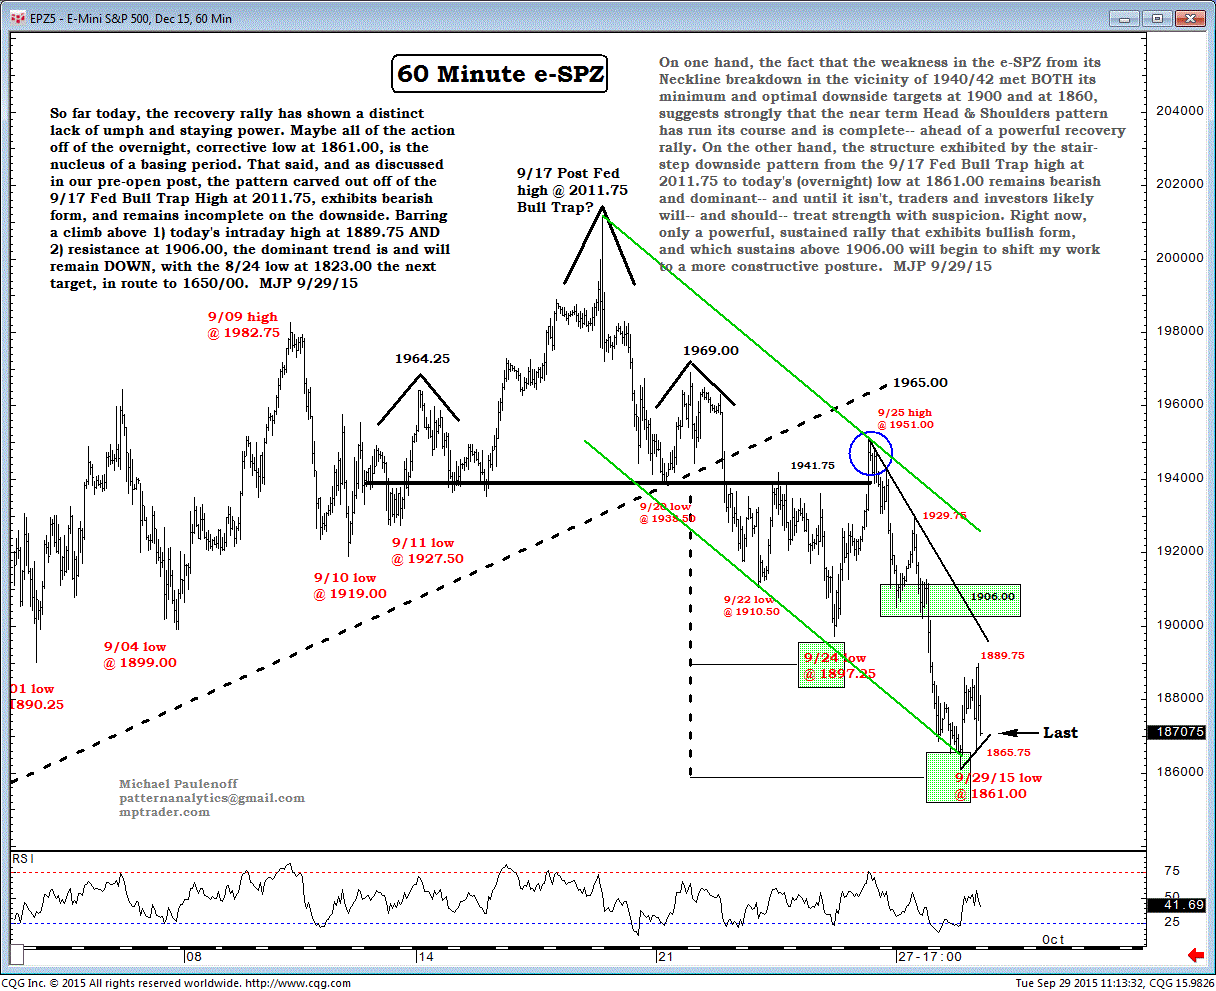
So far today, the recovery rally has shown a distinct lack of umph and staying power.
Maybe all of the action off of the overnight, corrective low at 1861.00, is the nucleus of a basing period.
That said, and as discussed in our pre-open post (see right side of chart), the pattern carved out off of the Sept 17, Fed bull-trap high at 2011.75, exhibits bearish form, and remains incomplete on the downside.
Barring a climb above 1) today's intraday high at 1889.75, and 2) resistance at 1906.00, the dominant trend is and will remain down, with the Aug 24 low at 1823.00 the next target, in route to 1650/00. MJP 9/29/15
On one hand, the fact that the weakness in the e-SPZ from its neckline breakdown in the vicinity of 1940/42 met both its minimum and optimal downside targets at 1900 and at 1860, suggests strongly that the near-term head & shoulders pattern has run its course and is complete-- ahead of a powerful recovery rally.
On the other hand, the structure exhibited by the stair- step downside pattern from the Sept 17, Fed bull-trap high at 2011.75 to today's (overnight) low at 1861.00 remains bearish and dominant-- and until it isn't, traders and investors likely will-- and should-- treat strength with suspicion.
Right now, only a powerful, sustained rally that exhibits bullish form, and which sustains above 1906.00 will begin to shift my work to a more constructive posture. MJP 9/29/15

