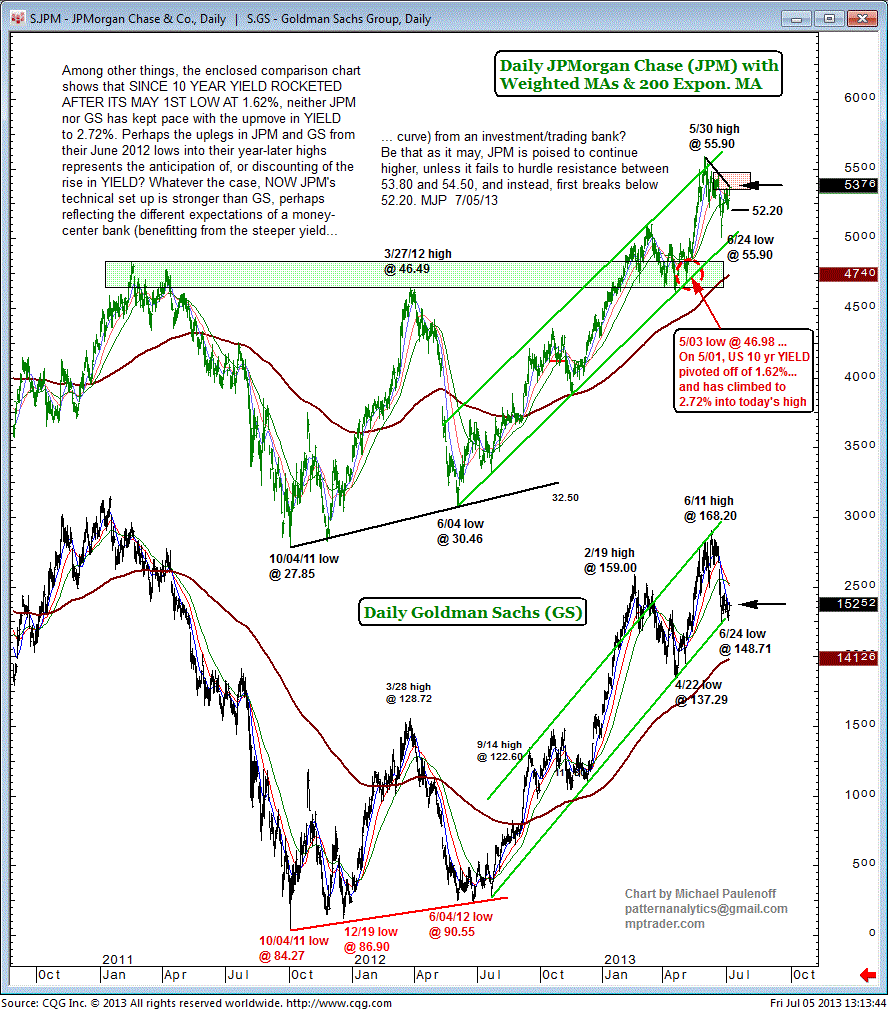
Some Banks Look Better Than Others
Among other things, the enclosed comparison chart shows that since 10-year yield rocketed after its May 1 low at 1.62%, neither JPMorgan Chase & Co. (JPM) nor Goldman Sachs Inc. (GS) has kept pace with the up-move in yield to 2.72%.
Perhaps the uplegs in JPM and GS from their June 2012 lows into their year-later highs represents the anticipation, or discounting, of the rise in yield?
Whatever the case, now JPM's technical set-up is stronger than GS, perhaps reflecting the different expectations of a money-center bank (benefitting from the steeper yield curve) from an investment/trading bank?
Be that as it may, JPM is poised to continue higher, unless it fails to hurdle resistance between 53.80 and 54.50, and instead, first breaks below 52.20.