TLT is Hinting at an Upside Reversal Right After 10-Year YIELD Kissed 2.50%
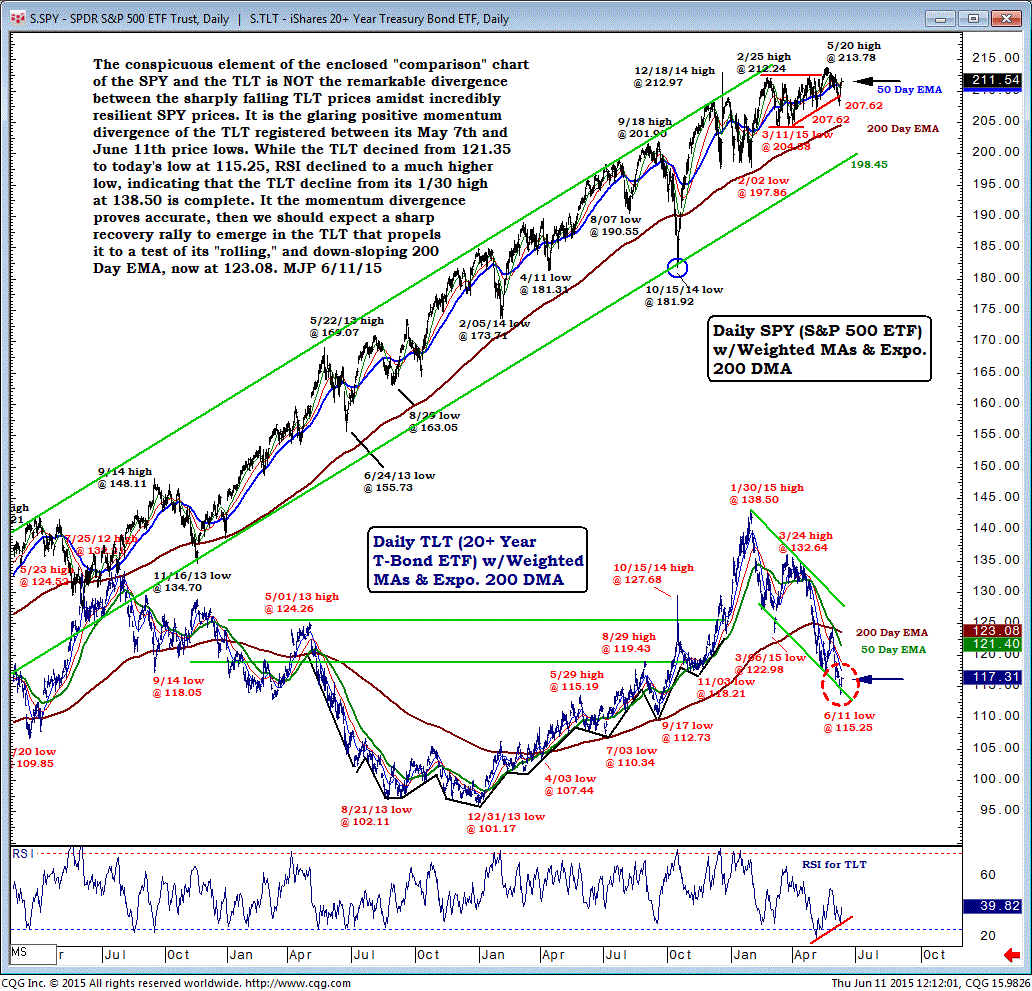
The conspicuous element of the enclosed "comparison" chart of the SPY and the iShares 20+ Year Treasury Bond (TLT) is not the remarkable divergence between the sharply-falling TLT prices amidst incredibly resilient SPDR S&P 500 (SPY) prices.
It is the glaring positive-momentum divergence of the TLT registered between its May 7 and June 11 price lows.
While the TLT declined from 121.35 to today's low at 115.25, RSI declined to a much-higher low, indicating that the TLT decline from its Jan 30 high at 138.50 is complete.
If the momentum divergence proves accurate, then we should expect a sharp-recovery rally to emerge in the TLT that propels it to a test of its "rolling," and down-sloping 200-Day EMA, now at 123.08.

