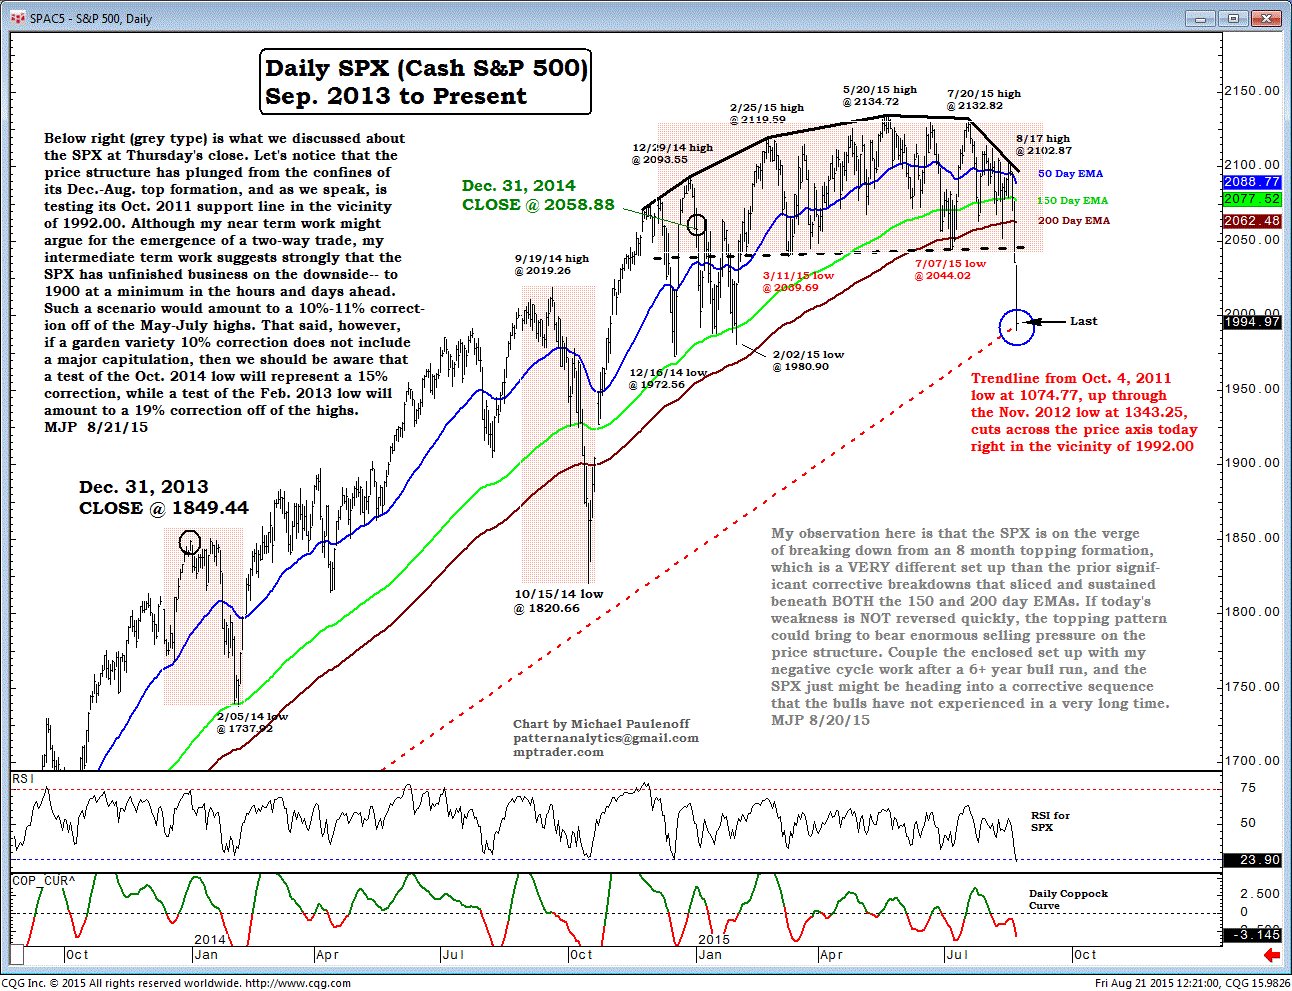
The Cash SPX Tests Its Oct 2011 Support Line
Below right (grey type) is what we discussed about the SPX at Thursday's close.
Let's notice that the price structure has plunged from the confines of its Dec-Aug top formation, and as we speak, is testing its Oct 2011 support line in the vicinity of 1992.00.
Although my near-term work might argue for the emergence of a two-way trade, my intermediate-term work suggests strongly that the SPX has unfinished business on the downside-- to 1900 at a minimum in the hours and days ahead.
Such a scenario would amount to a 10%-11% correction off of the May-July highs.
That said, however, if a garden-variety, 10% correction does not include a major capitulation, then we should be aware that a test of the Oct 2014 low will represent a 15% correction, while a test of the Feb 2013 low will amount to a 19% correction off of the highs. MJP 8/21/15
My observation here is that the SPX is on the verge of breaking down from an 8-month topping formation, which is a very different set-up than the prior significant, corrective breakdowns that sliced and sustained beneath both the 150- and 200-day EMAs.
If today's weakness is not reversed quickly, the topping pattern could bring to bear enormous selling pressure on the price structure.
Couple the enclosed set-up with my negative-cycle work after a 6-plus-year’s bull run, and the SPX just might be heading into a corrective sequence that the bulls have not experienced in a very long time. MJP 8/20/15