The Flight to Safety into Treasuries Intensifies
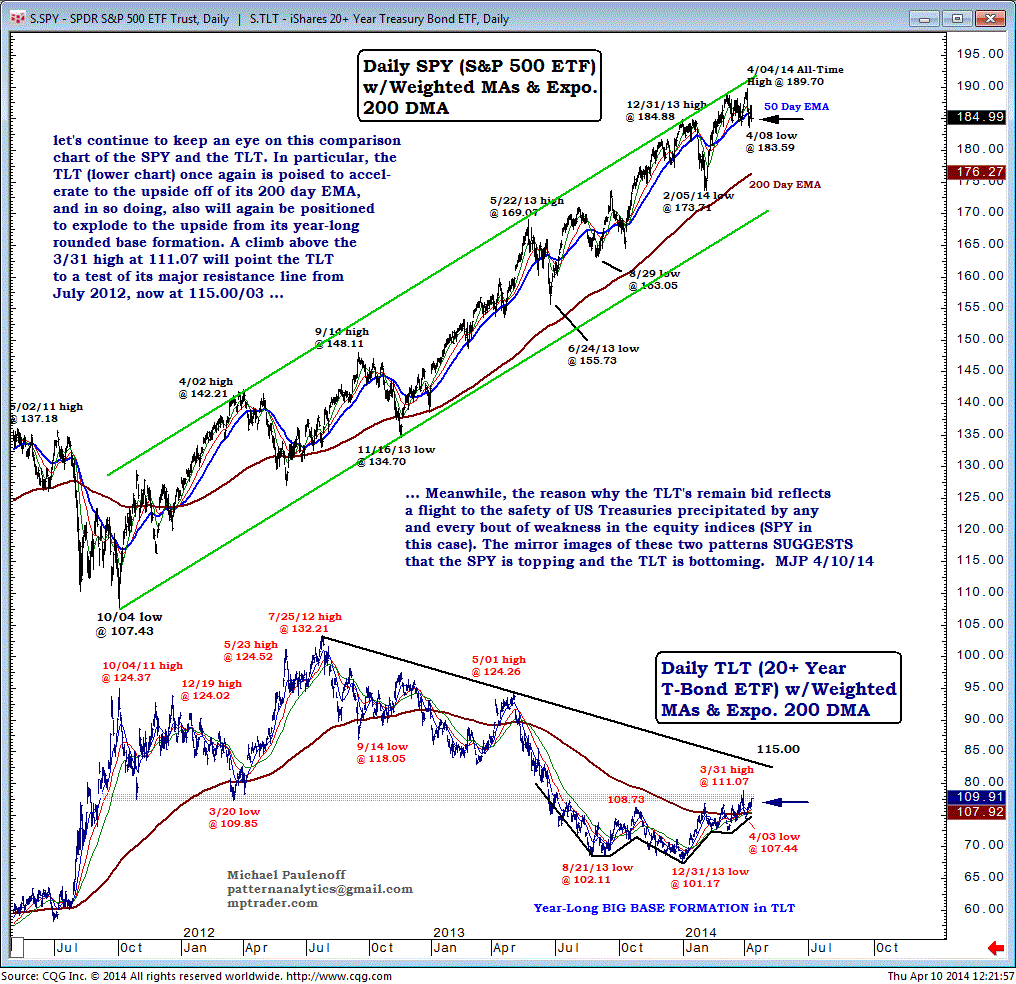
Let's continue to keep an eye on this comparison chart of the SPDR S&P 500 (SPY) and the iShares 20+ Year Treasury Bond (TLT).
In particular, the TLT, shown in the lower chart below, once again is poised to accelerate to the upside off of its 200-day EMA, and in so doing, also will again be positioned to explode to the upside from its year-long rounded-base formation.
A climb above the Mar 31 high at 111.07 will point the TLT to a test of its major resistance line from July 2012, now at 115.00/03.
Meanwhile, the reason why the TLT's bid reflects a flight to the safety of US Treasuries precipitated by any and every bout of weakness in the equity indices, SPY in this case.
The mirror images of these two patterns suggest that the SPY is topping and the TLT is bottoming.