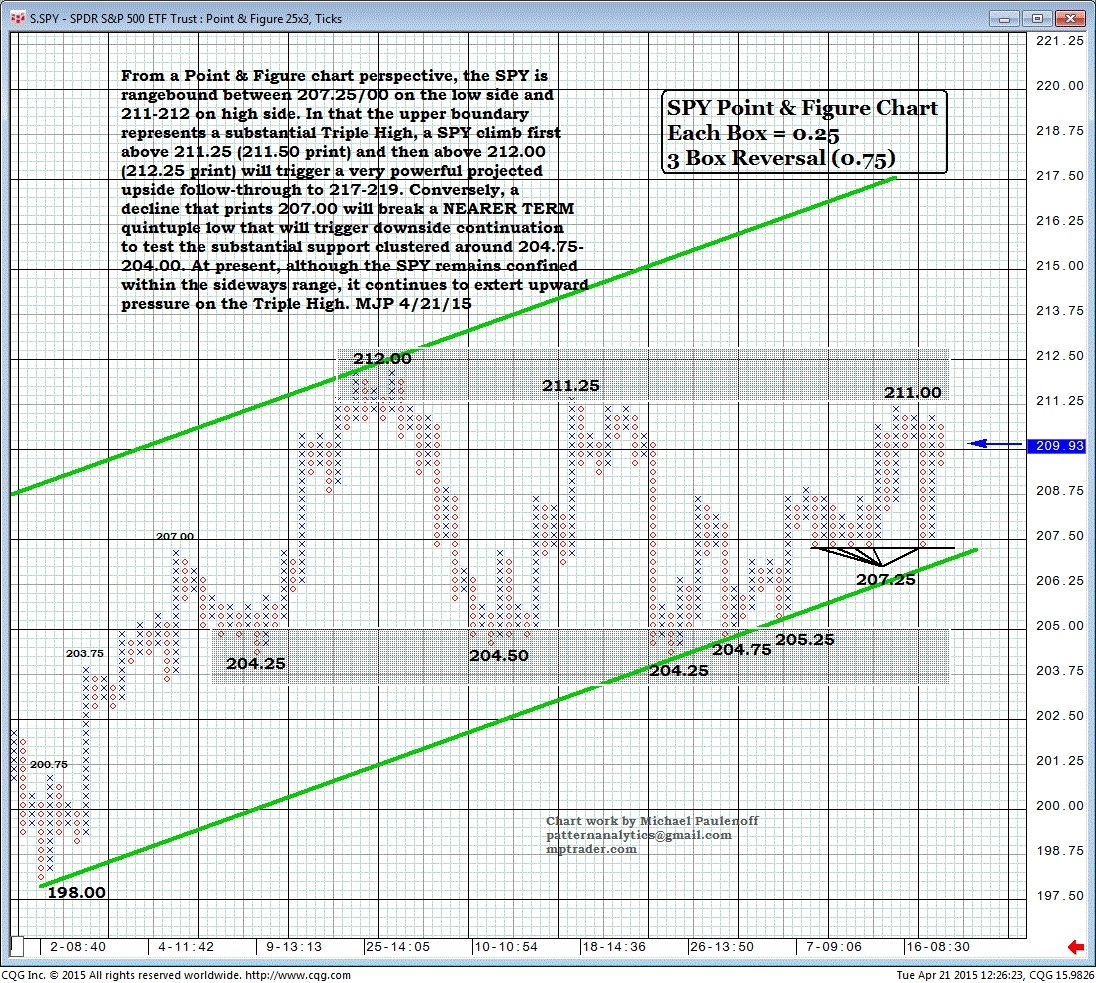
The SPY P&F Chart Demarcates Bull-Bear Battle Lines
From a Point & Figure chart perspective, the SPY is range-bound between 207.25/00 on the low side and 211-212 on high side.
In that the upper boundary represents a substantial triple high, a SPY climb first above 211.25 (211.50 print), and then above 212.00 (212.25 print), will trigger a very powerful, projected, upside follow-through to 217-219.
Conversely, a decline that prints 207.00 will break a nearer-term quintuple low that will trigger downside continuation to test the substantial support clustered around 204.75- 204.00.
At present, although the SPY remains confined within the sideways range, it continues to exert upward pressure on the triple high.

