The Tale of Two Treasury Yields
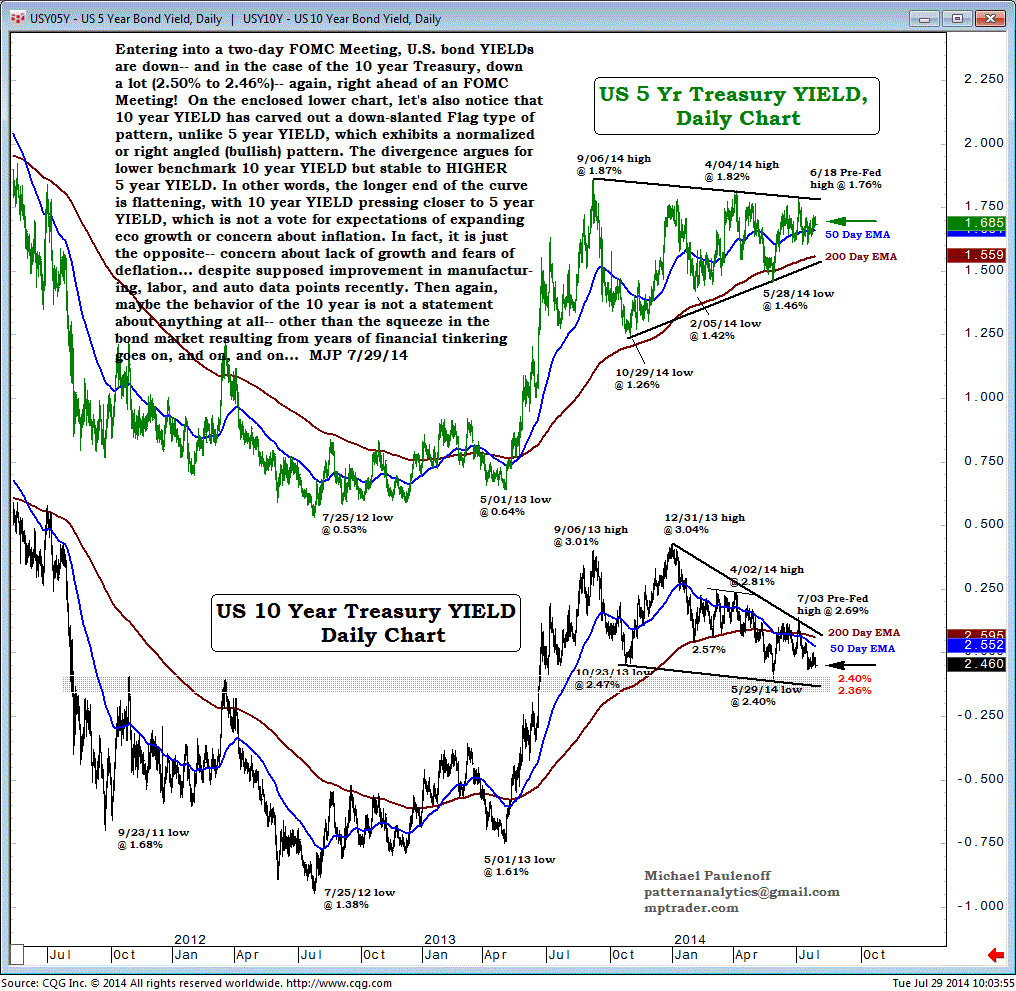
Entering into a two-day FOMC Meeting, U.S. bond Yields are down, and in the case of the 10-year Treasury, down as much as 2.50% to 2.46% again, right ahead of an FOMC Meeting!
On the lower chart, let's also notice that 10-year Yield has carved out a down-slanted flag-type pattern, unlike 5-year Yield, which exhibits a normalized or right-angled (bullish) pattern.
The divergence argues for lower benchmark 10-year Yield, but stable to higher 5-year Yield.
In other words, the longer end of the curve is flattening, with 10-year Yield pressing closer to 5-year Yield, which is not a vote for expectations of expanding eco-growth or concern about inflation.
In fact, it is just the opposite--concern about lack of growth and fears of deflation despite supposed improvement in manufacturing, labor, and auto data points recently.
Then again, maybe the behavior of the 10-year Yield is not a statement about anything at all, other than the squeeze in the bond market, resulting from years of financial tinkering that goes on, and on, and on....

